Eclipse-day planning
Quick links
The following quick-link tables lead to useful sources of satellite imagery and numerical (model) forecasts. A fuller explanation of the sources can be found below the tables.
Satellites
Site | Description | Go-to Link |
College of DuPage | A site used by storm chasers and one of the quickest to update with new images at 5-minute intervals . No mouse-wheel zoom, but can select from many high-resolution sectors. All wavelengths including colour composites. Can overlay radar, highways, and station weather reports, making this site the most useful for quick relocation to a more favourable spot. Auto refresh. | |
Windy | A commercial site popular with eclipse chasers in 2023. Zoom with mouse wheel. Auto-refresh. | |
US National Weather Service GOES Image Viewer: | A comprehensive site for the United States and nearby Canada and Mexico. All wavelengths available. No zoom, but continent is divided into high-resolution sectors. Can be set to auto-refresh. |
Numerical Models
Model Source | Link | Description |
Windy | Windy free version opens in global ECMWF model, generally regarded as the best of the long-range predictions. Five other models available for quick comparison. Many parameters available but cloud is likely the most critical. NAM and HRRR models don’t go much beyond the US borders but ICON and GFS are global. | |
College of DuPage | A favourite storm-chaser’s site with a limited number of models available, mostly from Canada and the U.S. Not all models show cloud cover. The NAMNST model has a simulated satellite image of future cloud, out to 60 hours. Very limited ECMWF data. GFS model goes out 16 days. | |
Spot Weather | Spotwx provides you with graphical displays of weather parameters at a single location (which can be anywhere on the globe). Easy to use, with several models available for North America. You’ll have to go to the other sites above to look around for better weather, but if you are not trying to move, it will help you monitor what the numerical world thinks is coming to you at your site. No ECMWF. | |
Pivotal Weather | Pivotal Weather, also a favourite with storm chasers, offers access to a large number of long- and short-range models(ECMWF, GFS, GDPS, NAM, and so on). You may wish to explore the GEFS and the CMCE models, which are ensemble models (the average of many models) that extend to 16 and 10 days respectively and show cloud cover. See the description below. Watch out for the colour scheme: clear areas are white and cloudy areas are blue. Your cursor will show forecast cloud amount in percent. One of my favourites, but no satellite images. For an early look at eclipse day, the CFS model goes out 32 days but doesn't include cloud cover. |
Background notes about the satellites
The 2024 TSE could be a meteorological challenge. While the Eclipsophile climate studies are useful for long-range planning, they becomes less and less helpful when eclipse day is less than a week away. By late March, 2024, eclipse-day tactics should turn to the regular long- and short-range forecasts available from a number of agencies. On the day before the eclipse, numerical forecasts have lost much of their value and should be augmented by satellite and radar data and by reports from surface weather stations.
Satellites maintain a continuous watch across North America and the satellite of choice for this event is GOES East, located over the equator and streaming images at 5-minute intervals. There are many public and commercial web sites that can do proper justice to the resolution of GOES E imagery, but you will probably appreciate those that show full-colour images.
This eclipse comes in the middle of the day for the most part and so satellite images in visible wavelengths will be available for a few hours before the shadow reaches Mazatlán and for the whole day by the time it reaches Bonavista, Newfoundland. Even so, if you anticipate a long trip to clear skies, you will have to make use of the infrared images, which work at night.
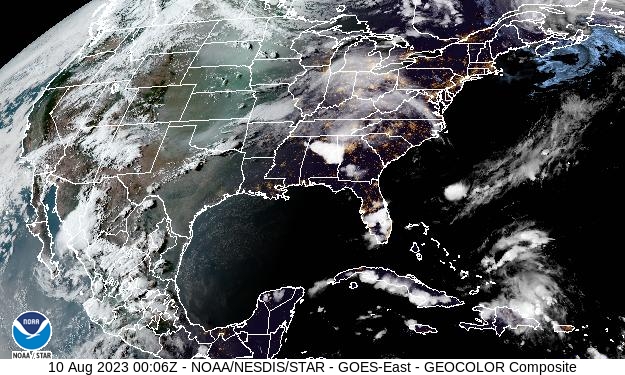
The raw satellite data arrive at receiving stations as gray-scale images in many different wavelengths. Among those wavelengths, the current mix of geostationary satellites collect scenes in red, green, and blue frequencies during the daytime—a mixture that can be combined into a colour image as long as the Sun is up. When the Sun is down, a “pseudo-colour” image can be assembled from a mix of infrared wavelengths that mimics the appearance of daytime clouds (Figure 1). The day and night images merge well together—almost seamlessly—and now many sites offer the combination (GEOCOLOR) on their web sites.
Images from single wavebands are also commonly available, and you may wish to look at some of these, most likely at night if you are confronted by a difficult situation such as overnight fog.
For the most part, images from one Internet site are similar to those from another, but they differ in their interfaces and ability to zoom. The capability to put highways and station reports on top of the satellite image in the College of Dupage site could be valuable in a difficult, fast-changing situation.
A short primer on numerical models
Satellite photos are OK for what is happening now, but they are pretty limited in predicting what the weather will do two days in the future. For that information, we need to use computer forecasts (usually referred to as numerical forecasts or model forecasts). There are many types of numerical forecasts, way more than a dozen if you go looking. They are usually models run by countries for their own interests, but they share the code used in the models, so they are not completely independent of each other.
Types of models
There are two types of models: global long-range ones and regional short-range forecasts. In the U.S., the main long-range model is the GFS (15 days); short-range models are the NAM (84 hours), the RAP (21 hours), and the HRRR (18 hours). Canada contributes the GDPS for long range (15 days), and the RDPS (84 hours). The most commonly used European long-range model is the ECMWF, generally regarded as the most reliable, but it’s a commercial product and you have to look around to get the parts of it you’d like, but it’s readily available on windy.com. There are many more, especially if you chase eclipses somewhere other than North America.
For the most part (but changing rapidly), long-range models have lower resolution than short-range versions. Windy.com displays the model resolutions on their menu page: ECMWF, 9 km; GFS, 22 km; ICON, 13 km; NAM, 5 km; HRRR, 3 km. High resolution doesn’t necessarily mean better, but high-resolution models do update more frequently, essentially updating the forecast. The differences between the models are embedded in the code that runs the models, and so are not visible to you. The internal bits include such things as how cloud cover and precipitation are calculated, so you must expect some substantial differences between models. With luck (?), they will converge on the correct answer as eclipse day approaches.
A special type of numerical forecast is a type called an ensemble model. These show an average of many different model calculations (runs), each one slightly varying the starting parameters. There are several of them available at Pivotal Weather, but only the American GEFS and Canada’s CMCE show cloud cover. The CFS climate model available on Pivotal Weather goes out for 32 days, well past eclipse time, but the day-to-day forecasts are so erratic that they can’t be used for planning. It is designed for long-range climate predictions.
Almost all of the commonly available forecast outputs in North America are models maintained by NOAA’s modelling arm, including those that are presented in your evening news broadcast. Only a few of the largest private companies maintain their own models. For the most part, large commercial companies don’t give you much choice on satellite images or numerical models, but they’ll probably focus on where to watch the eclipse on the days ahead and that professional opinion could be invaluable.
How do you handle all of this?
Pick two long-range and two short-range models and run with them. I guarantee total confusion if you use more—they are just too variable unless eclipse day is nearby.
Commercial sites usually only show you “their” model, as they don’t want to imply that there is some uncertainty in the future they foresee. In many cases, their model is the National Weather Service model with some fancy graphics attached.
Don’t rely on models until eclipse day is around the corner
A word of caution: models aren’t really very good until about a week ahead of an event, and should improve steadily as the moment approaches. You might use the NAM and the RDPS for the two-three days ahead of the eclipse and the long-range models before. Once the models start to look like each other, with similar cloud patterns and precipitation amounts and when successive model runs keep the same forecast, you can begin to trust them. There will always be differences between them, but even that will tell you where things are uncertain and help you decide whether you might want to move to a spot where they all agree about good weather.
When eclipse day arrives and the weather at your site is looking iffy, the local weather channel or a satellite image may be all that you need. For the most part, it concentrates on what’s happening now and what will happen in the next few hours. That may be all you need. In the end, preparation and mobility will be important contributors to your success.
Good luck on eclipse day. Don’t forget to watch the shadow go by in the satellite images afterward.
Return to Eclipsosphile.
Updated February 2024