Global Cloudiness by Month
These cloud-cover charts are derived from observations collected by polar-orbiting satellites across the years from 2000 to 2021. They have a map resolution of 0.25 degrees in latitude and longitude, which corresponds (at the the equator) to a spatial resolution of approximately 25 km.
The monthly images contain an entrancing record of the annual cycles of the weather. In them, we can watch the development of summer convection across the U.S. Plains, the evolution of the India and China monsoons, the onset of “The Wet” in Australia, the annual cycle of the Intertropical Convergence Zone (ITCZ) and many other seasonal changes as recorded in the cloud record.
A satellite does not “see” clouds; it sees radiance values in a half-dozen wavelength bands at a “pixel” resolution of 1.1 km. From these radiance measures, cloud algorithms estimate the cloudiness status of each pixel and assign it to one of four categories: cloudy, probably cloudy, clear and probably clear. The average cloud fraction over some period of time then becomes the sum of cloudy and probably cloudy estimates divided by the total number of analyzed grid squares. The data are obtained from many different satellites over the years.
It is evident that there are several problems with this scheme: a partly cloudy scene may be incorrectly assigned; visible wavelengths are not available at night or in low-light conditions; the infrared signatures of high and low, thick and thin clouds do not lend themselves to precise categorization; the type of cloud (water, ice or a mixture) complicates the infrared signatures; cloud temperatures are highly variable; the temperature of the surface below may mimic the characteristics of cloud (think of snow on the ground), and so on. Nevertheless, observations from satellite provide our best representation of the state of the Earth’s cloud climatology.
Each of these maps consists of just over a million grid squares averaged across 19 to 21 years of data collection. The dataset comes from EUMETSAT’s Satellite Application Facility on Climate Modelling (CM-SAF).
Click on the individual thumbnail images to obtain a higher-resolution map. Animations of day and night cloud patterns through the year can be found below the static images.
| Daytime Cloud | Nighttime Cloud |
January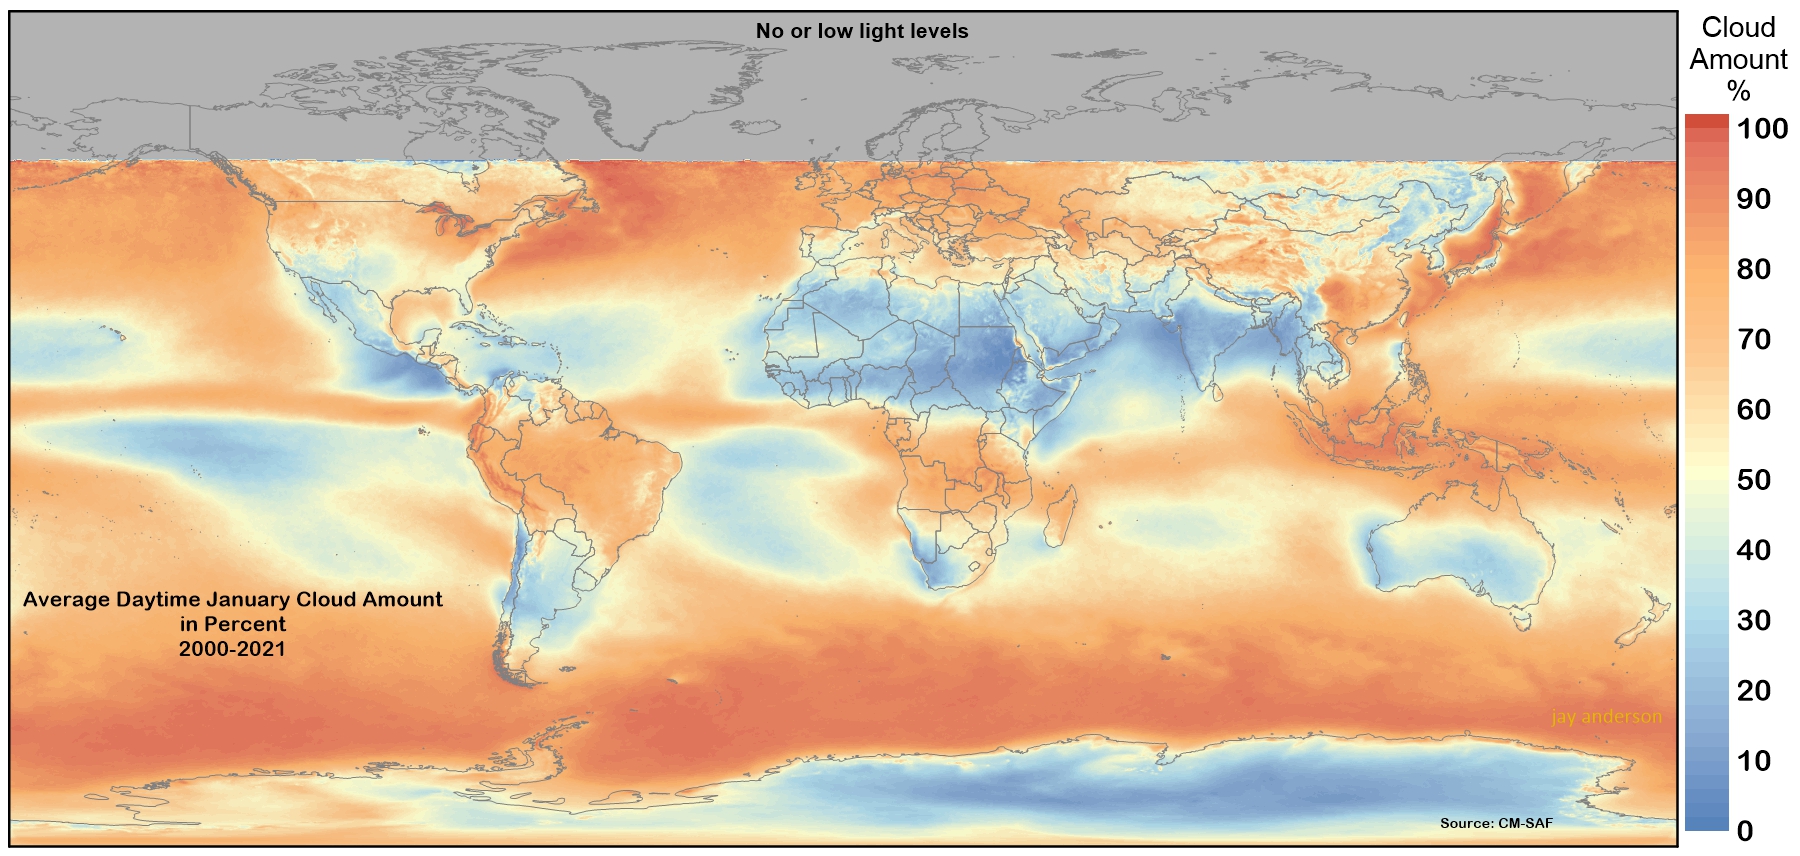 |
January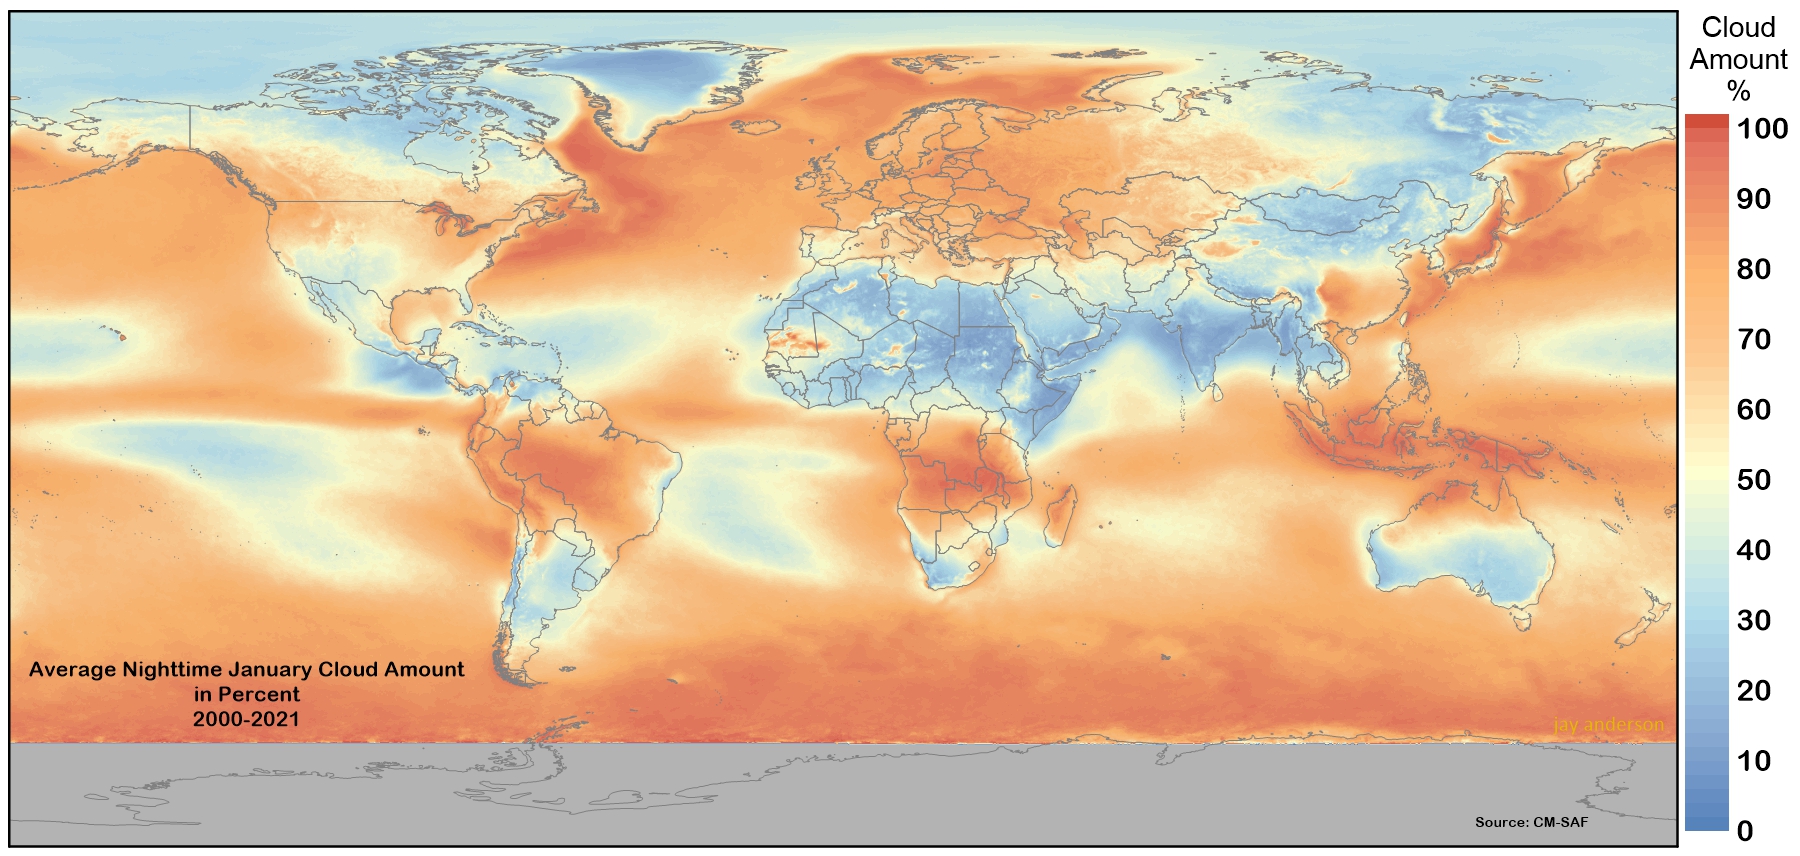 |
February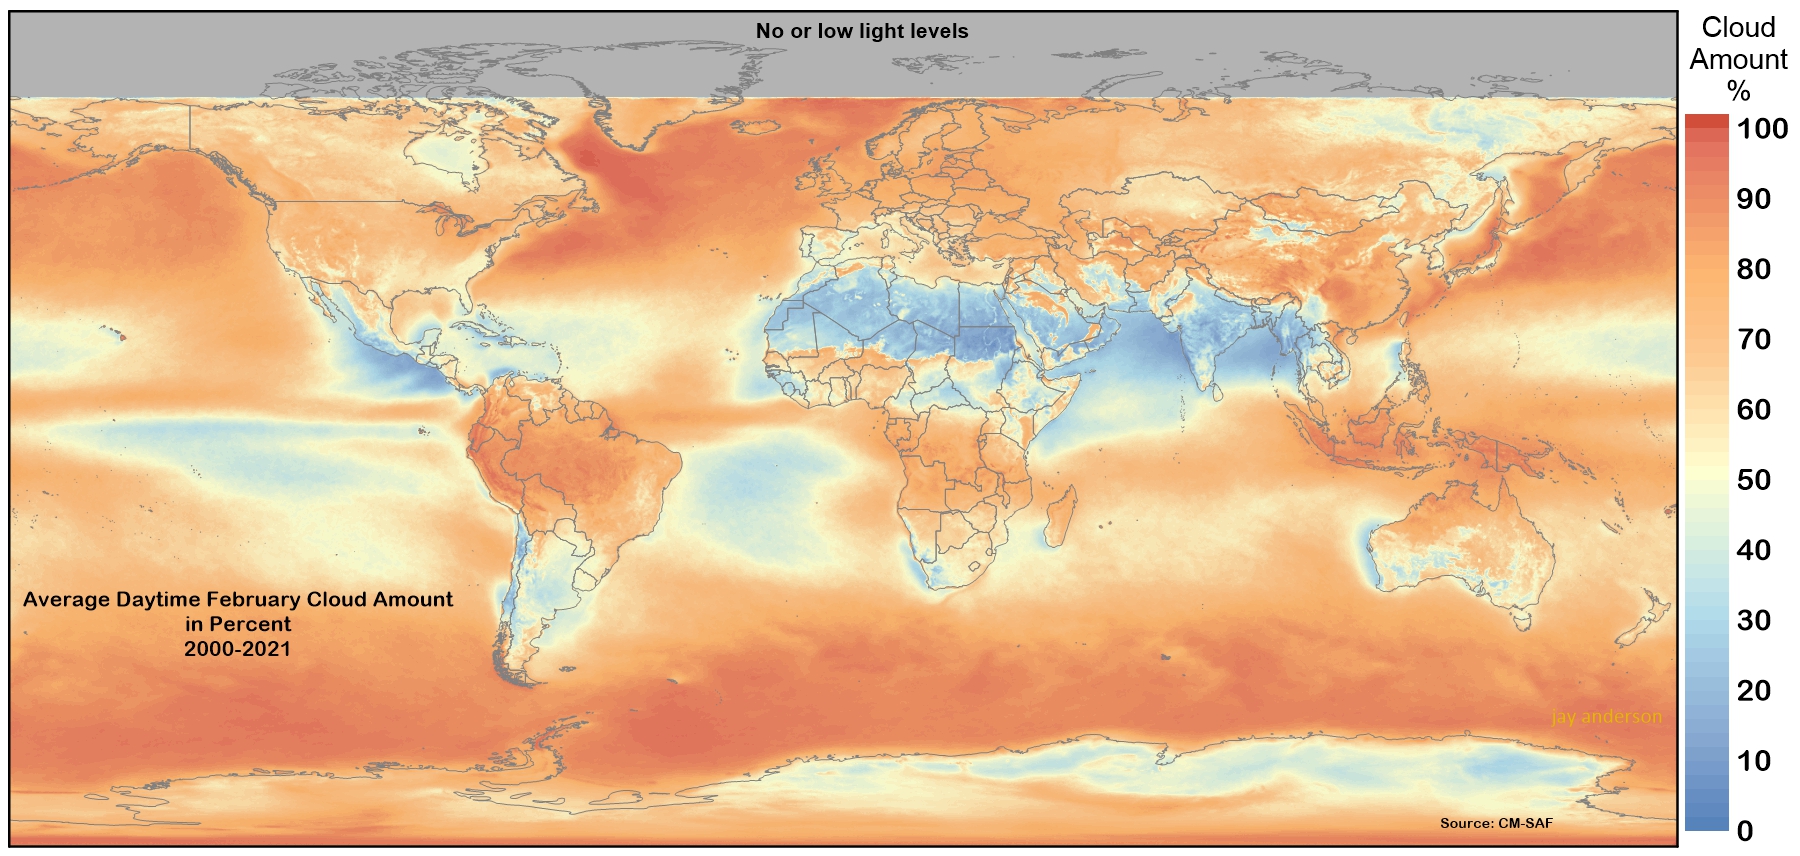 |
February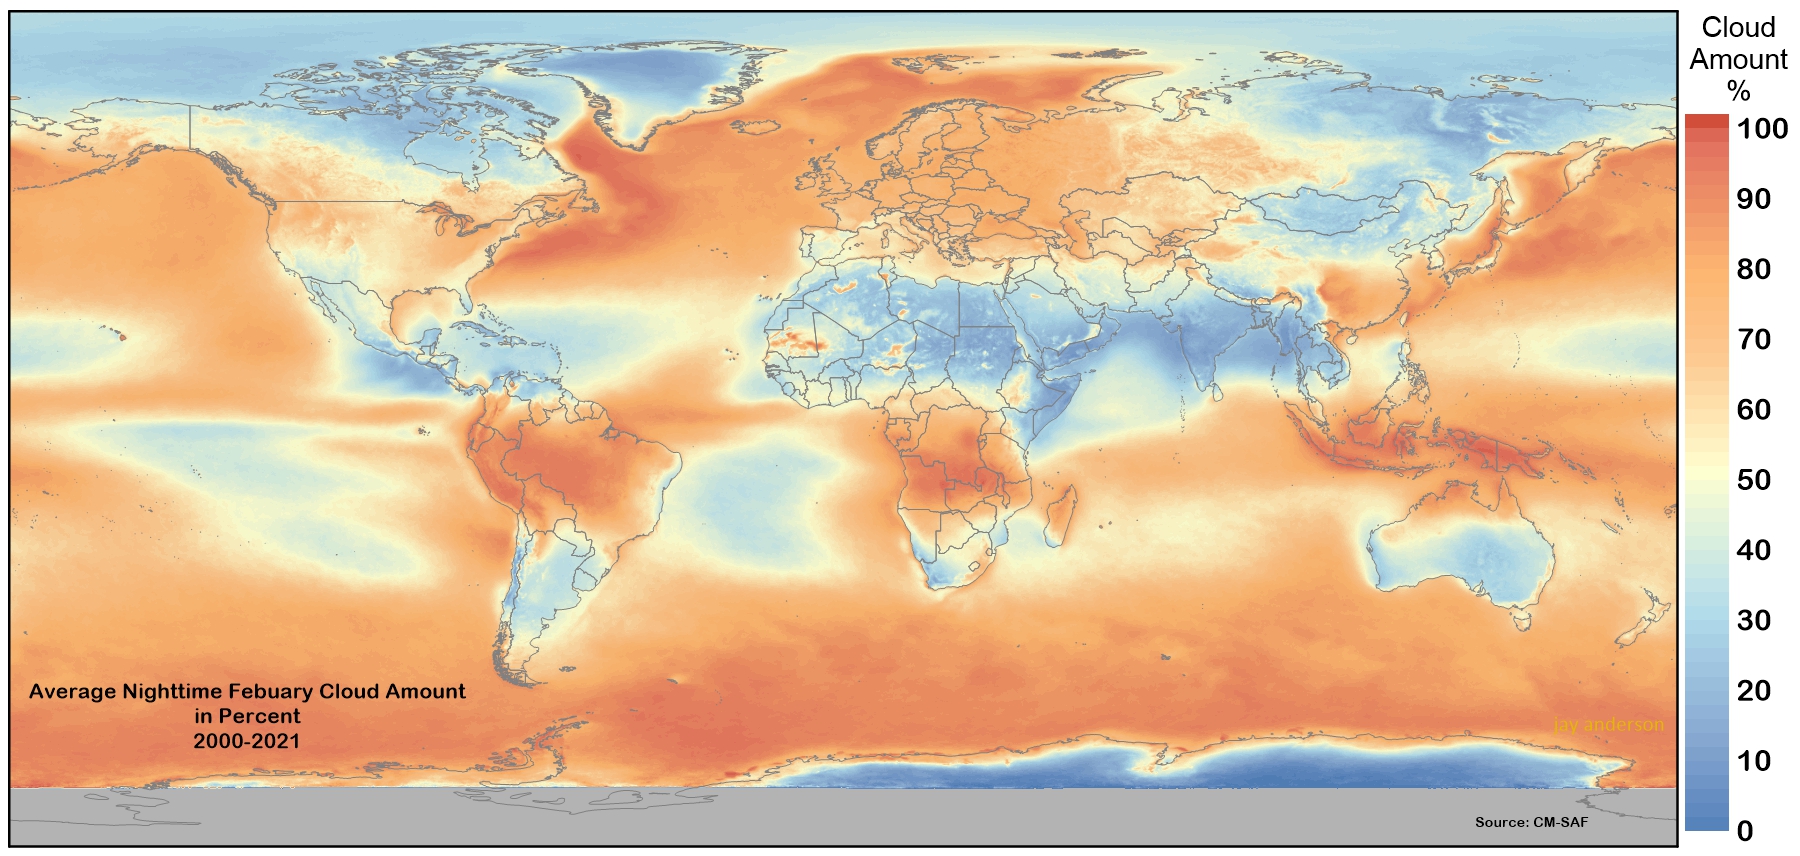 |
March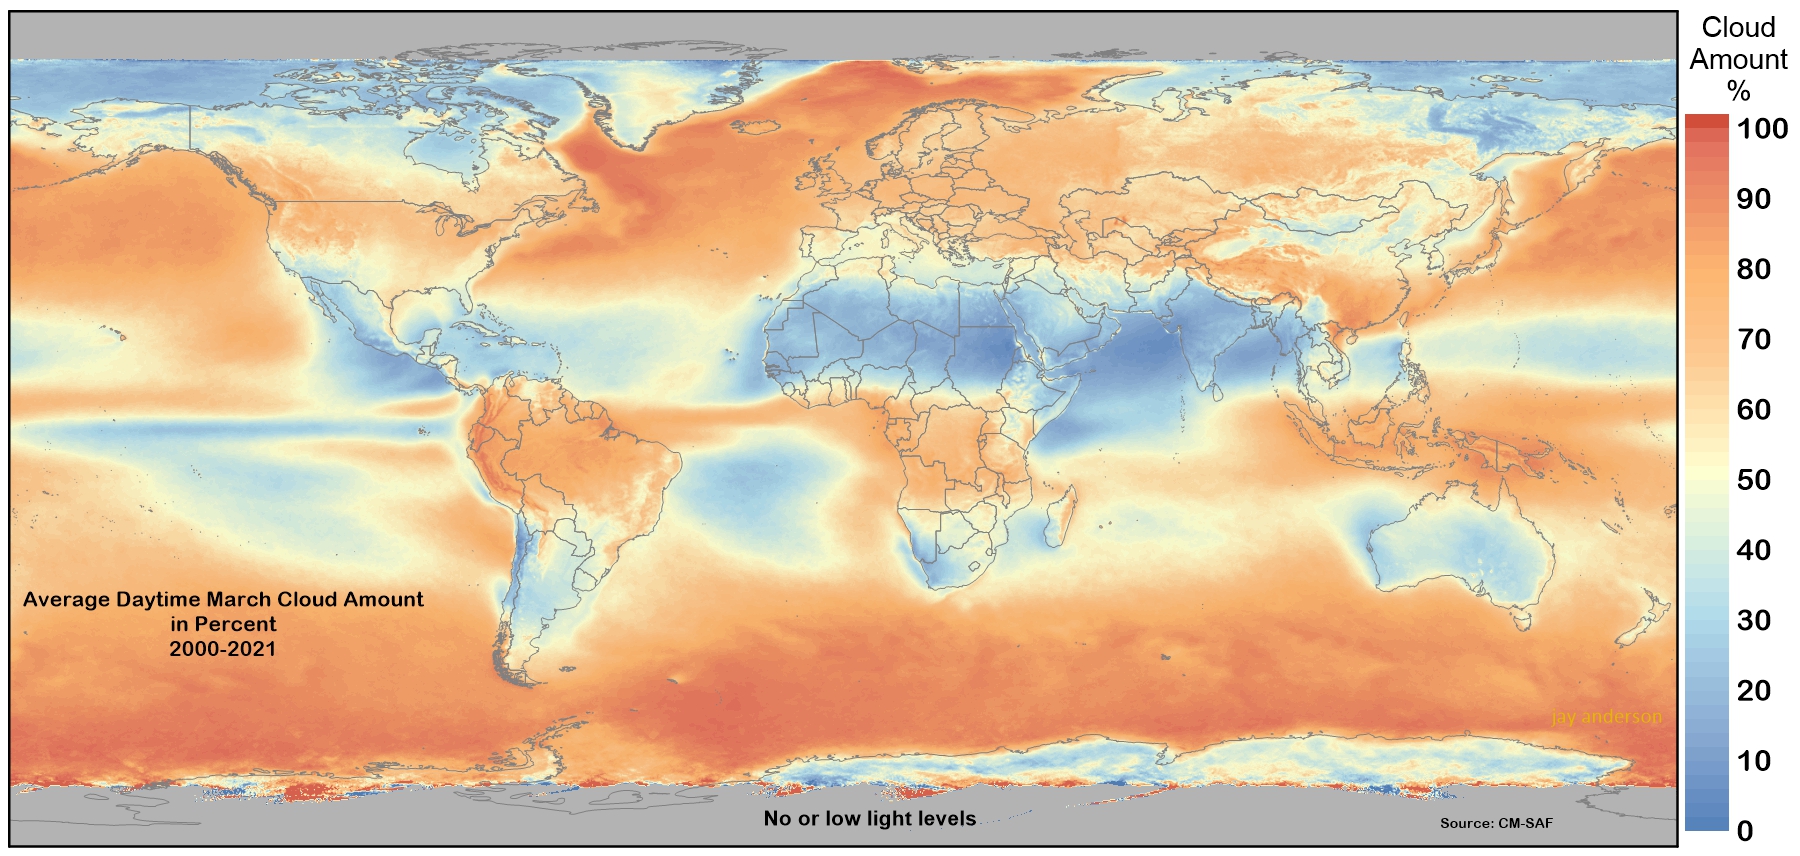 |
March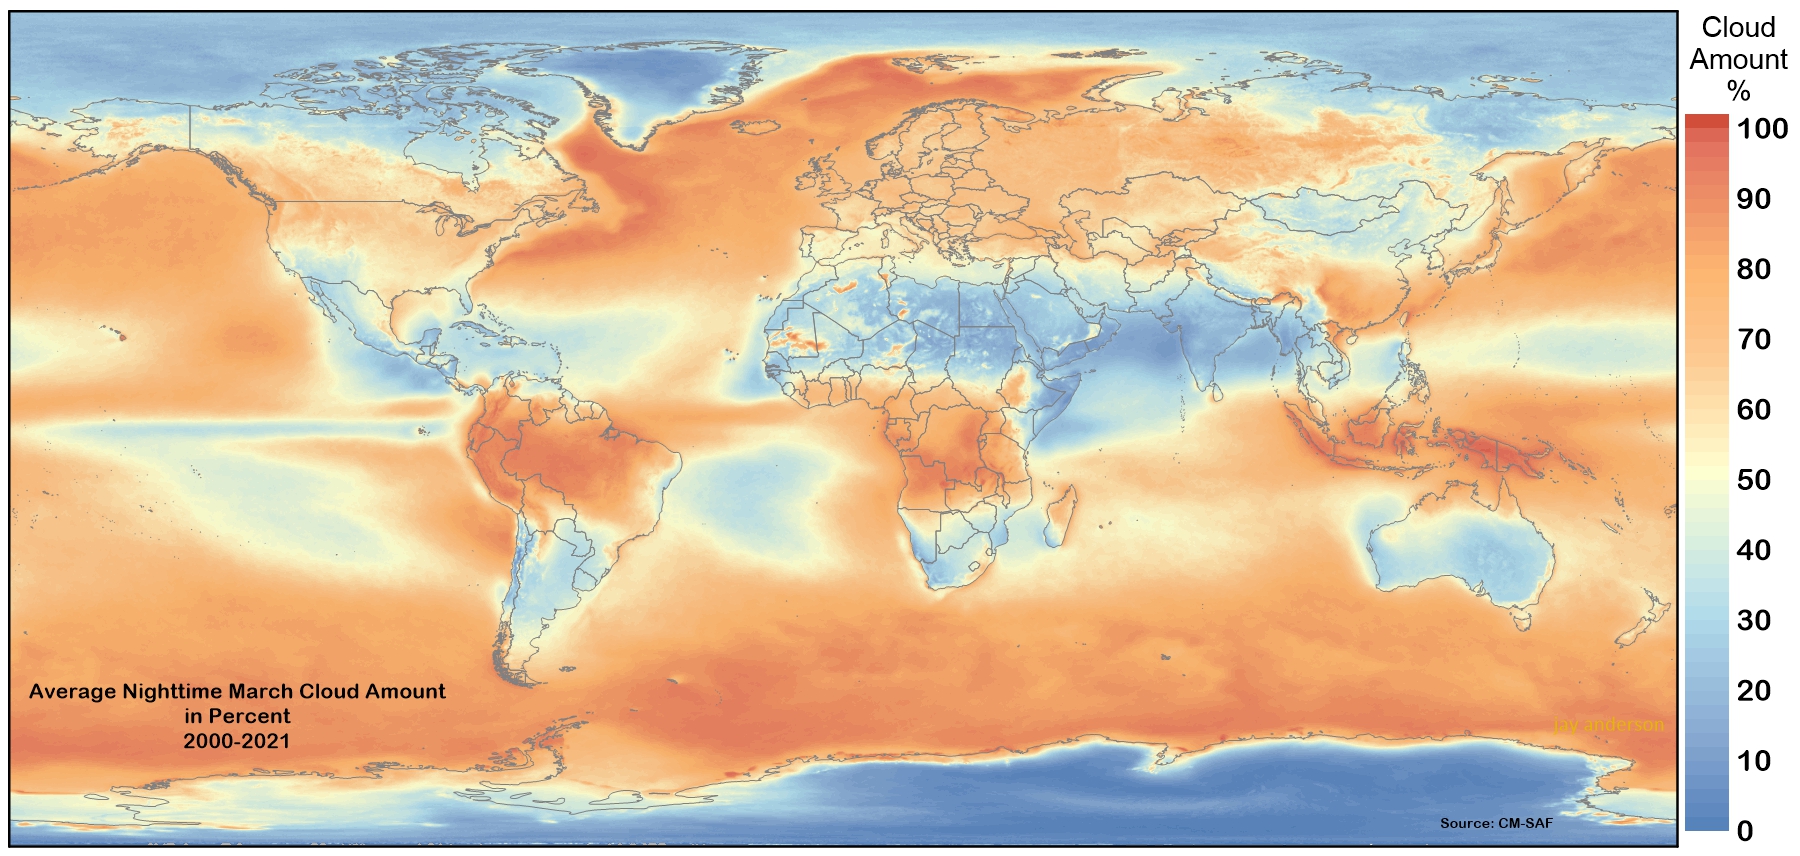 |
April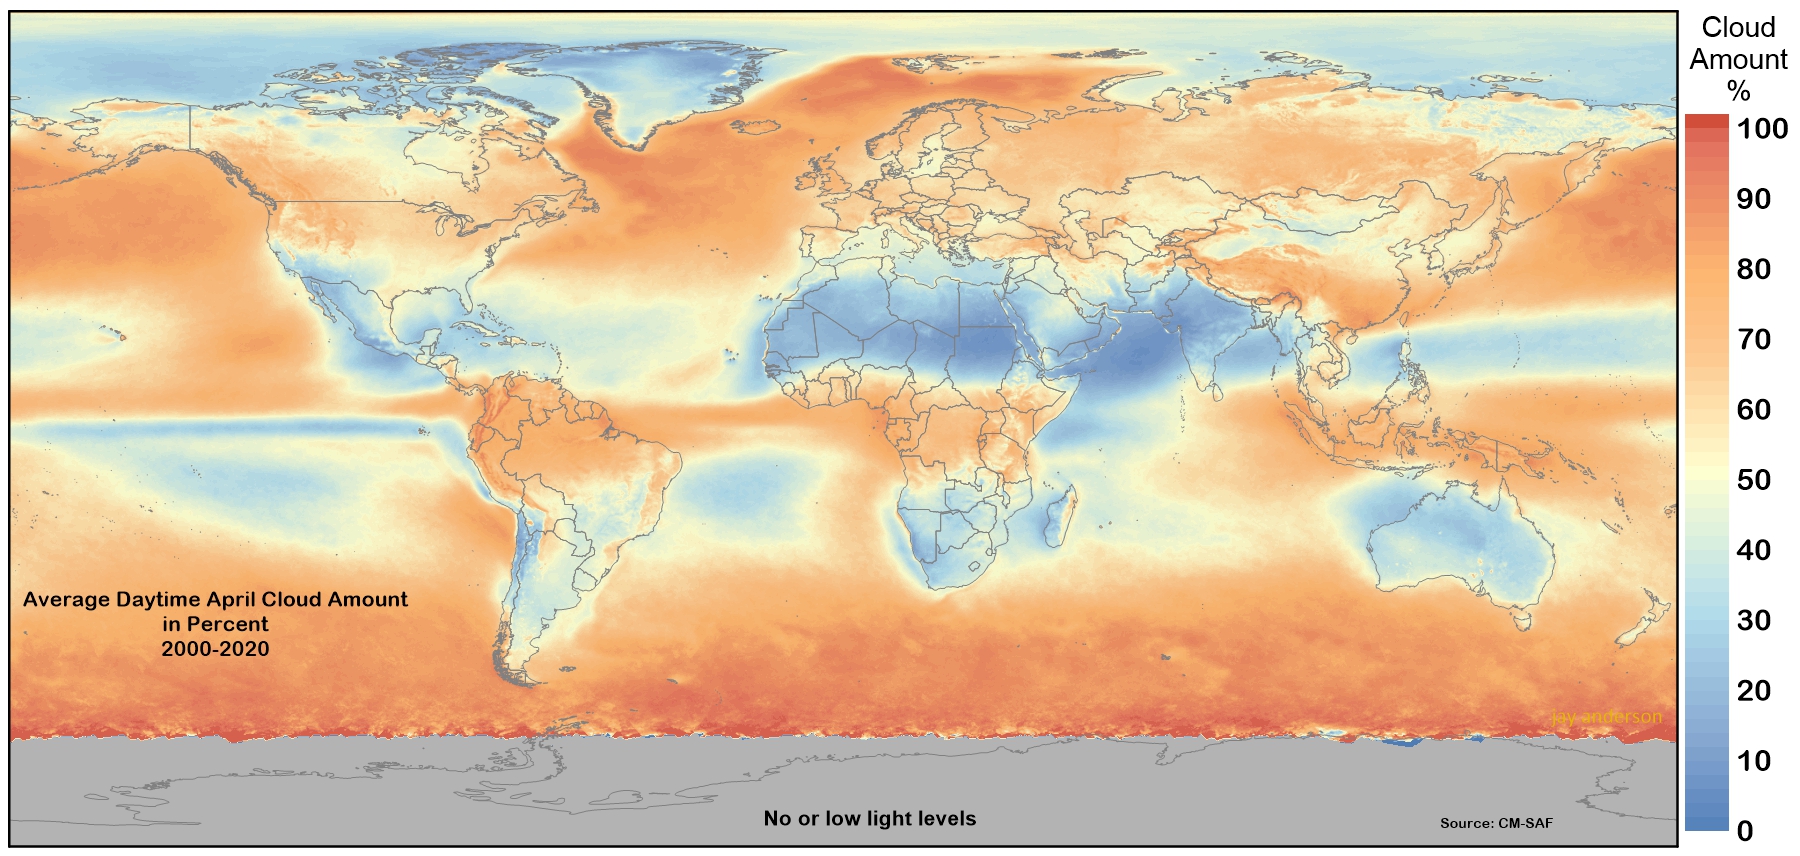 |
April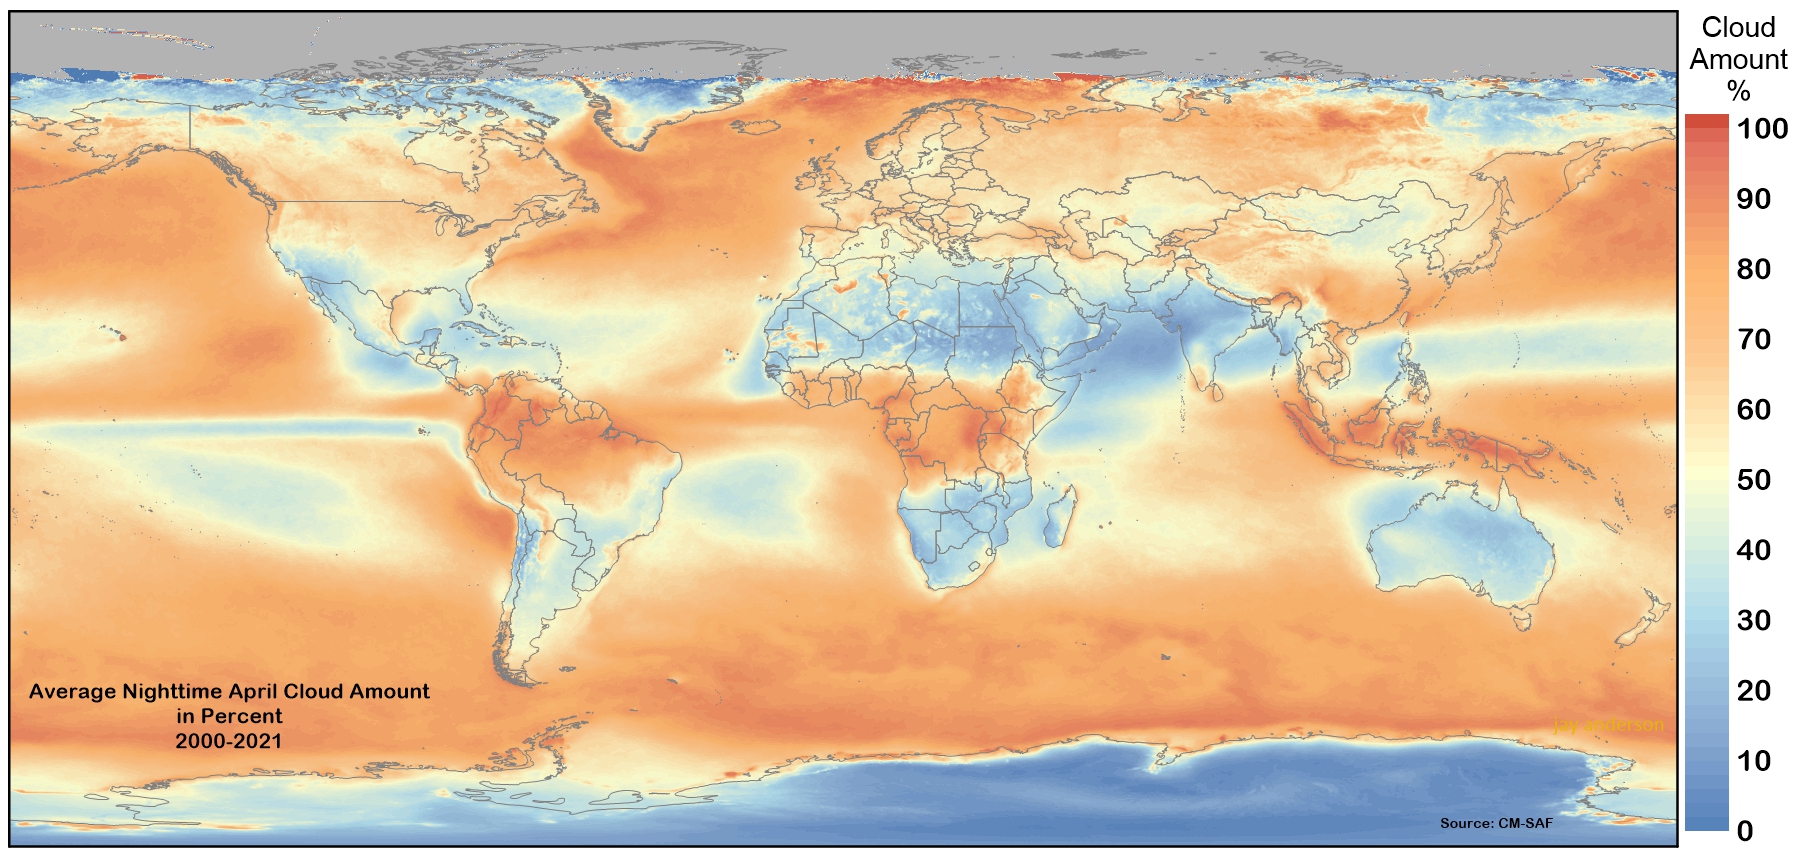 |
May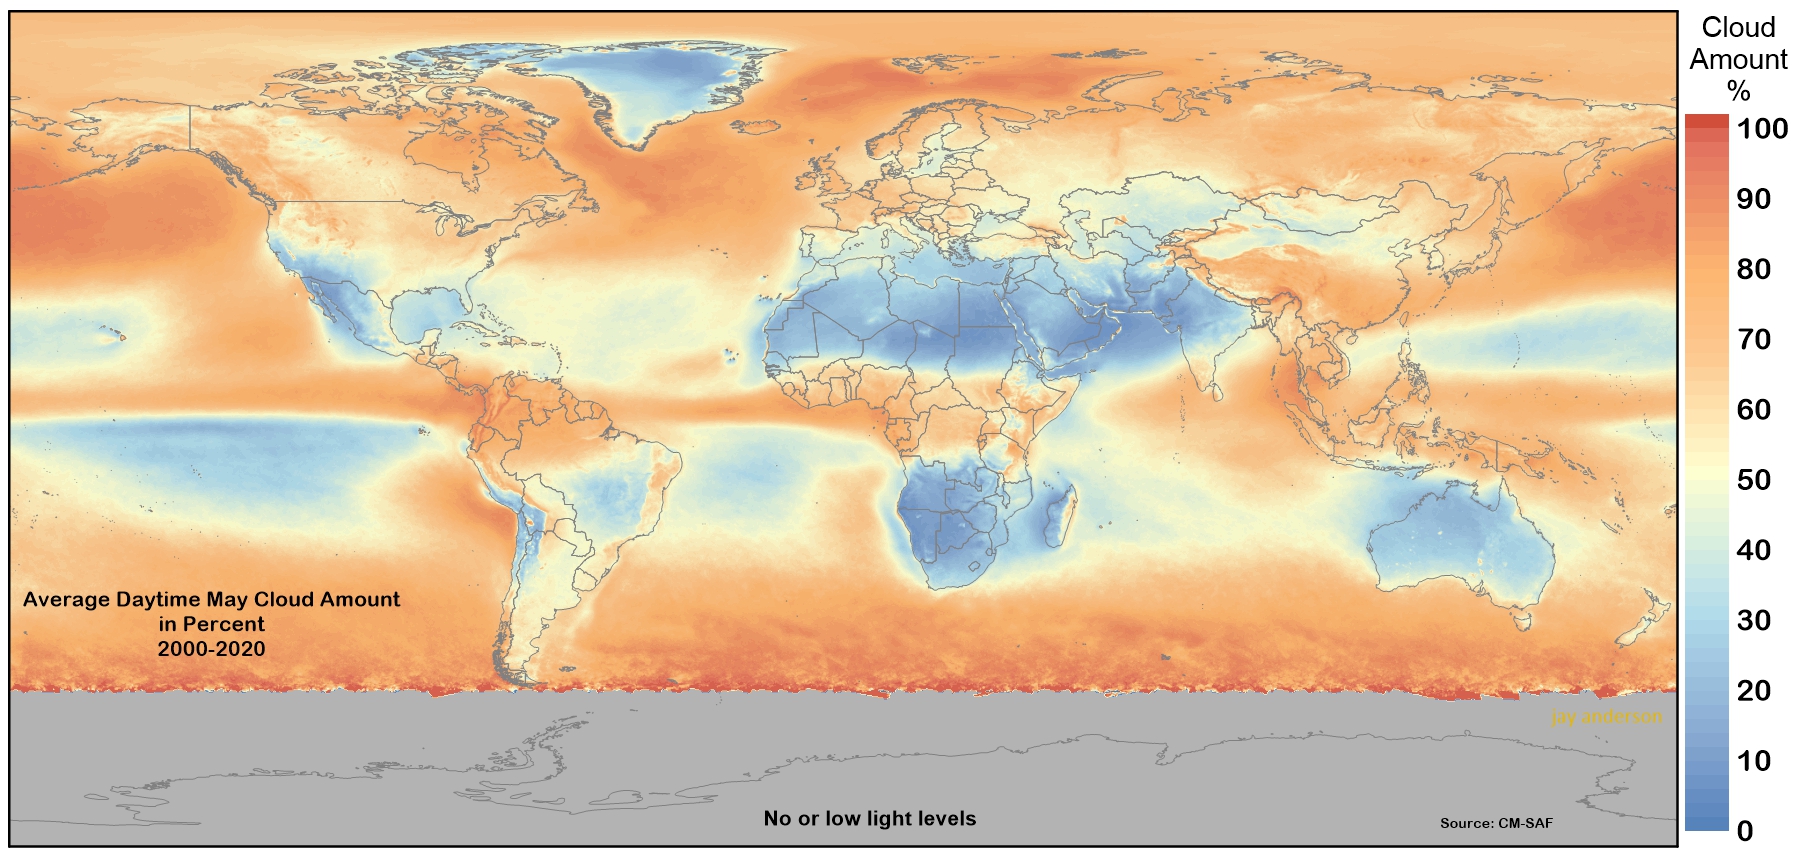 |
May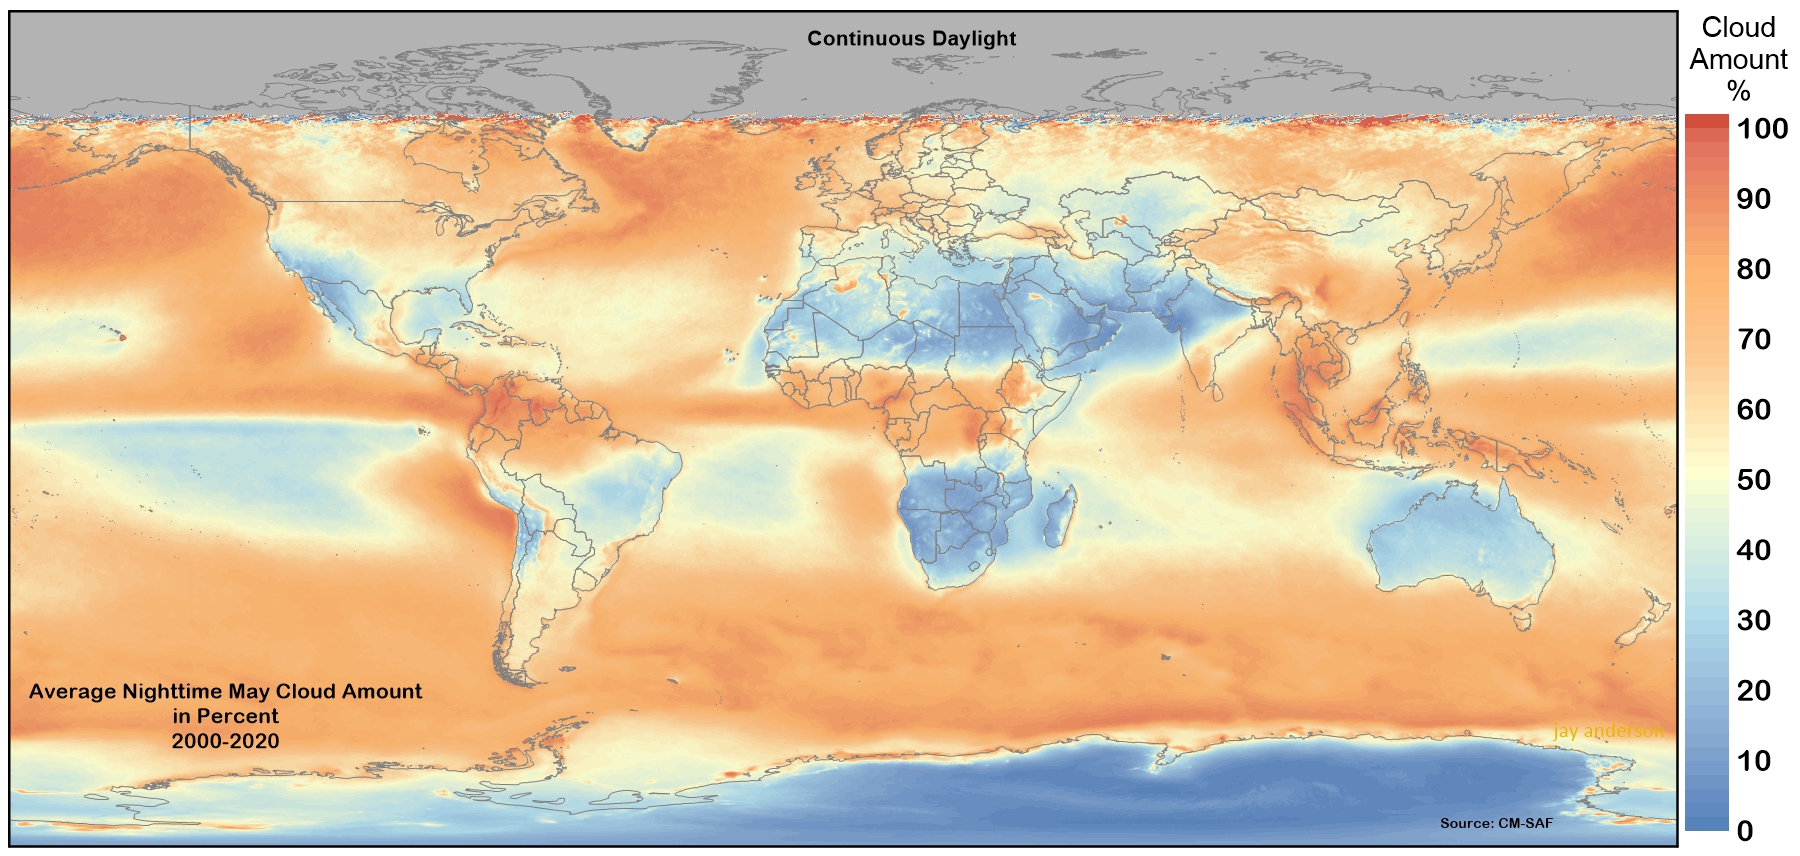 |
June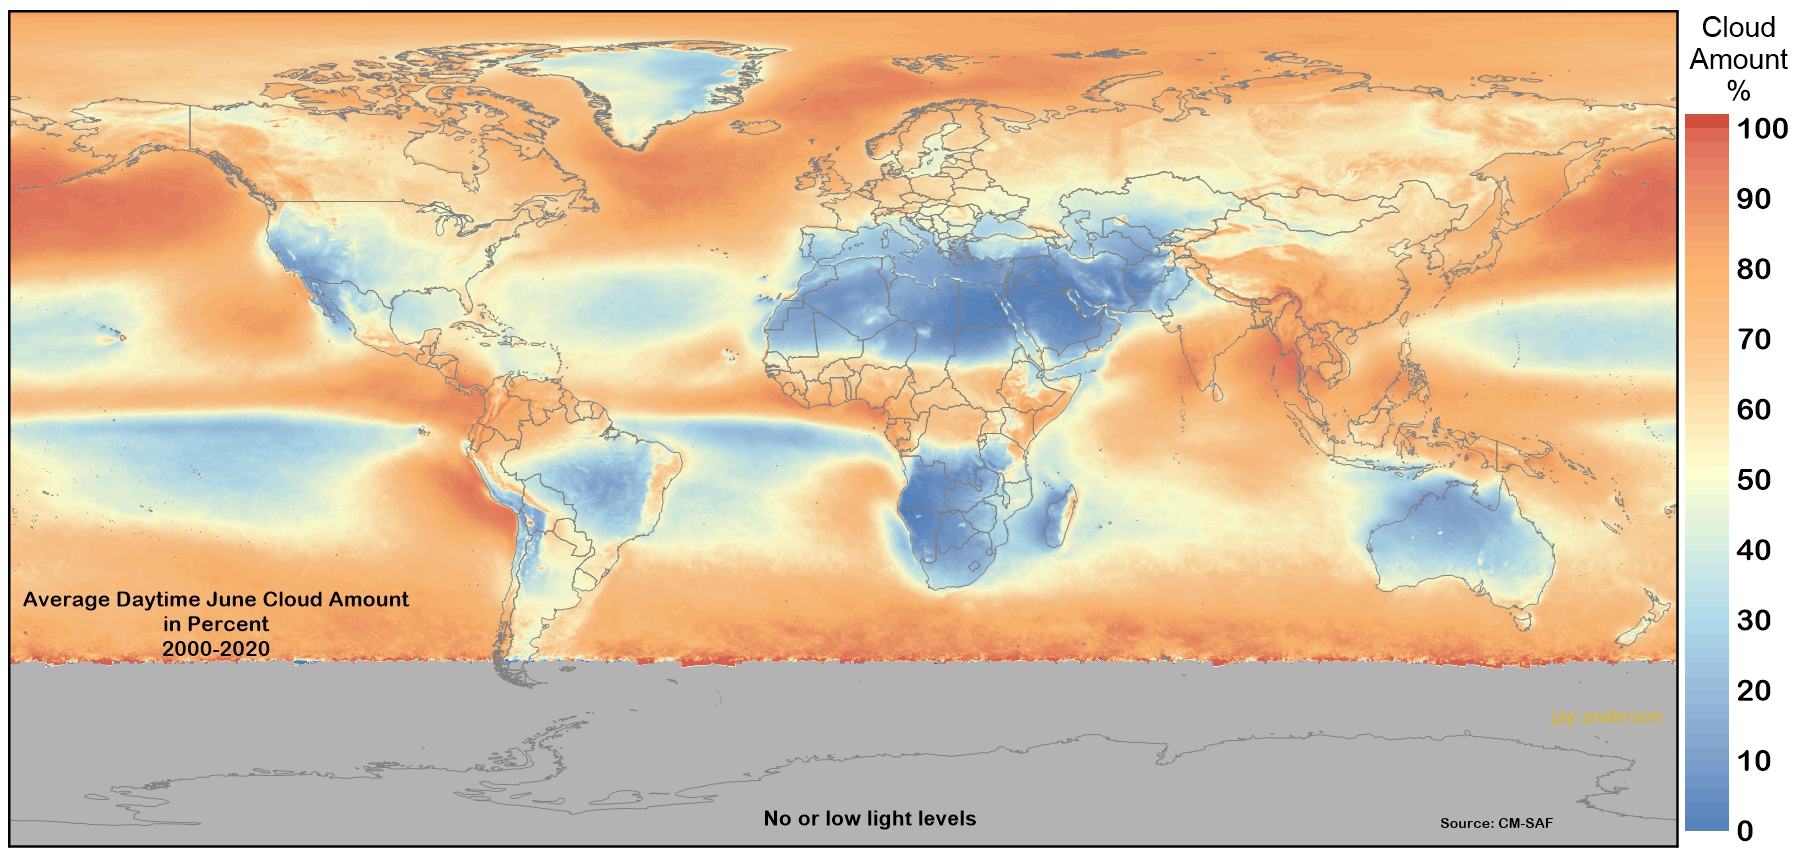 |
June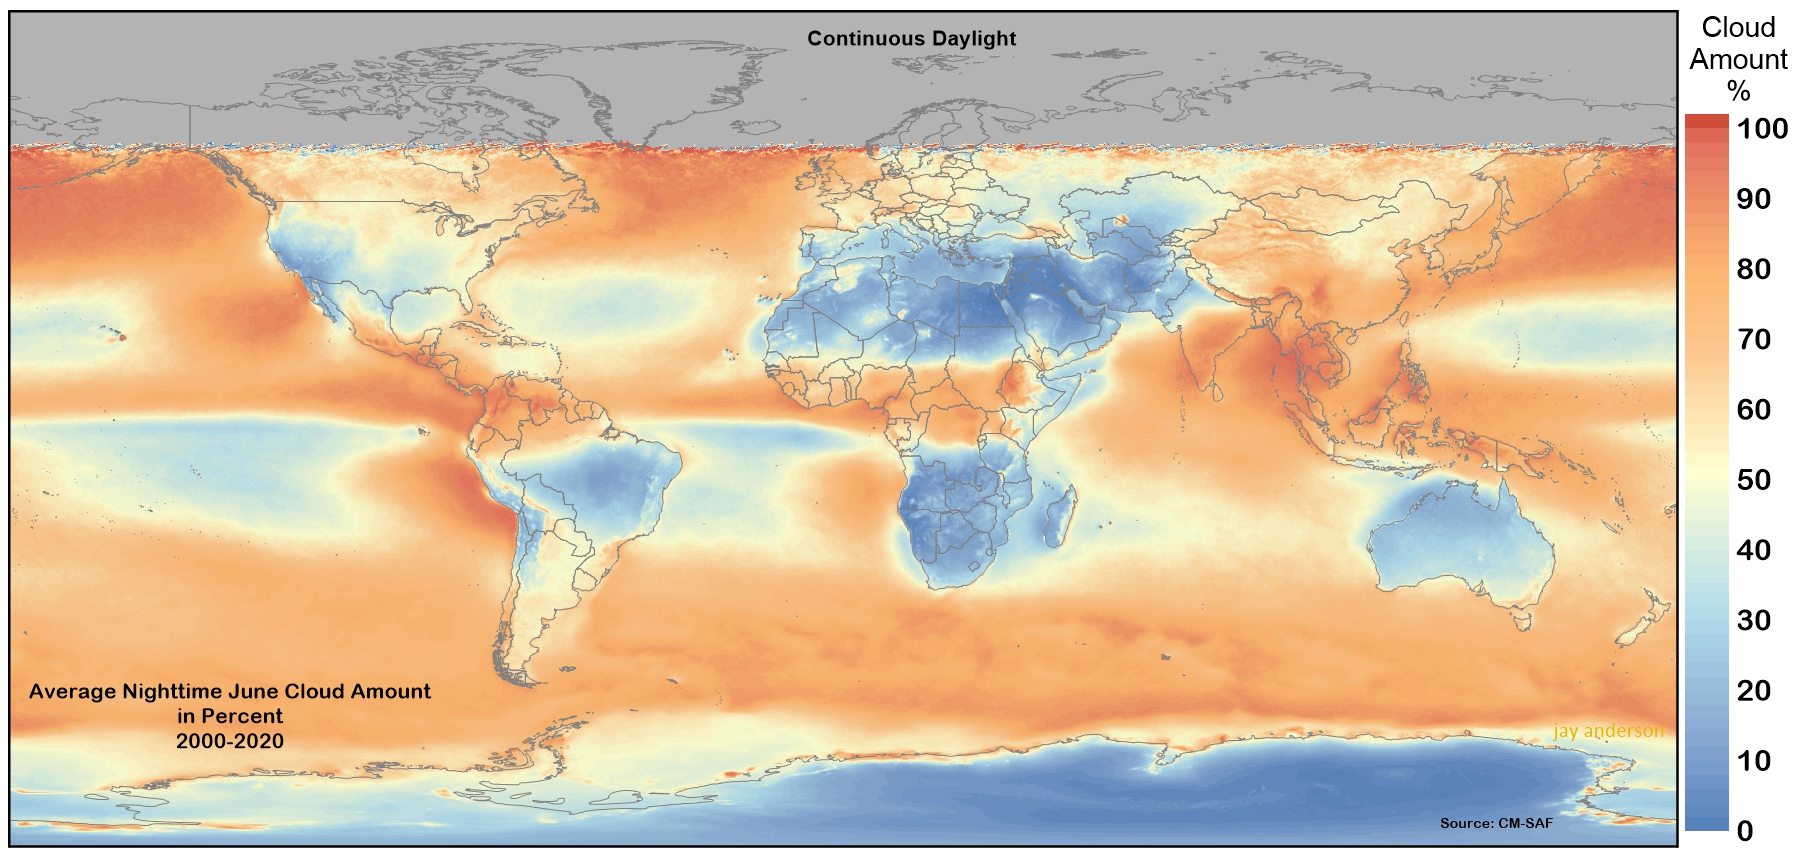 |
July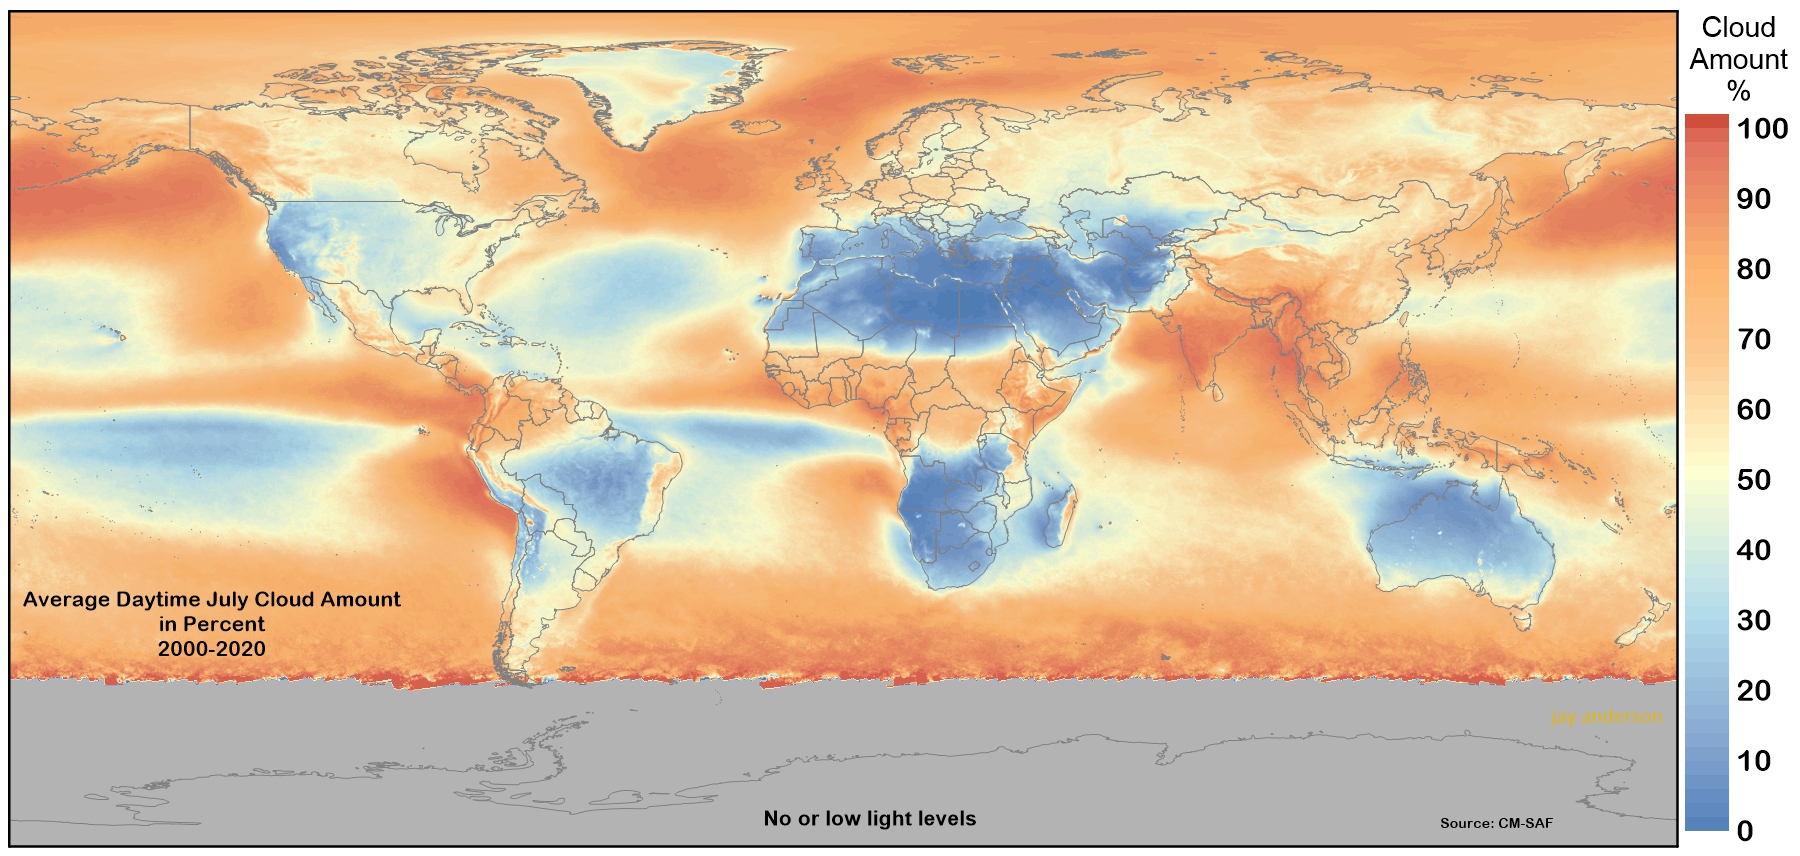 |
July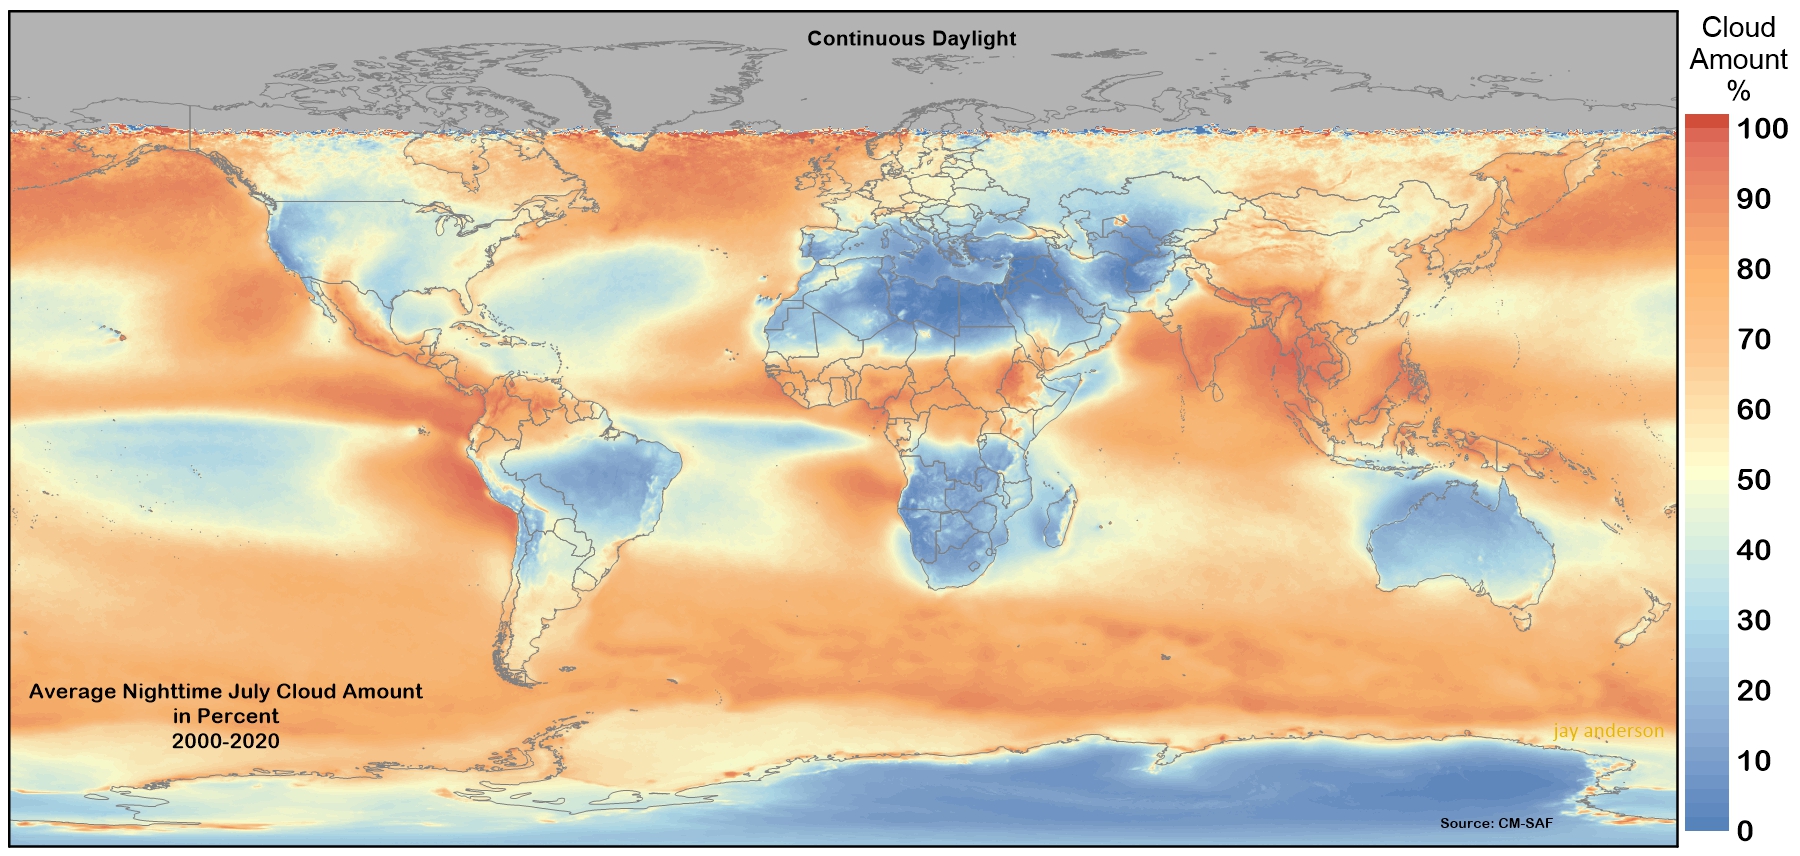 |
August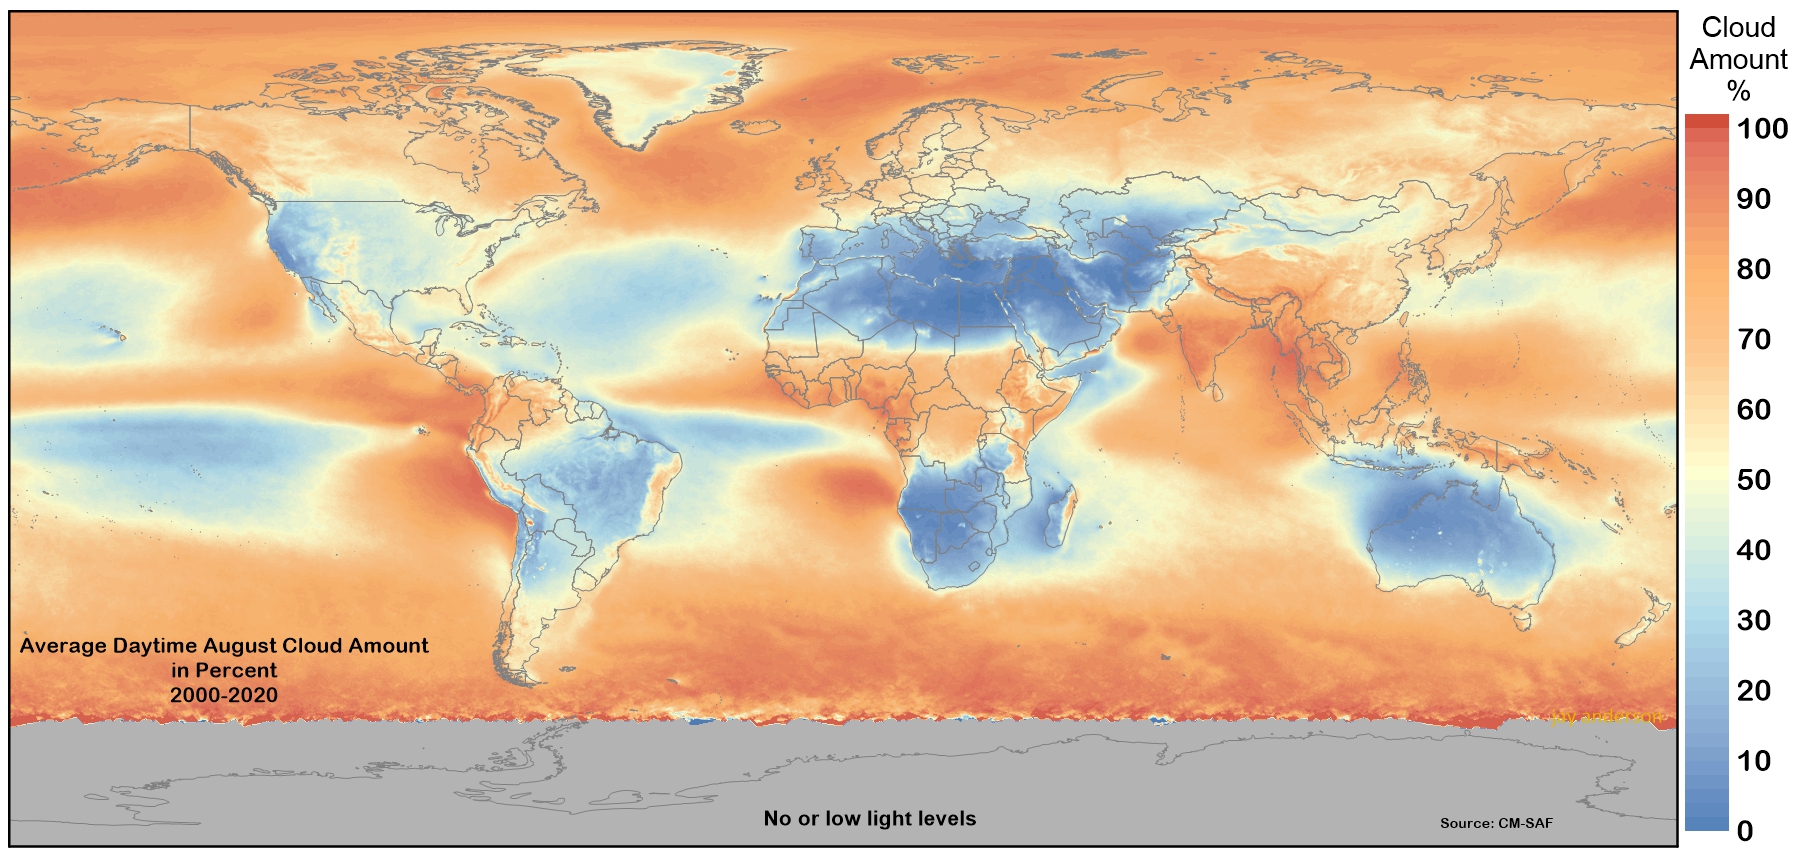 |
August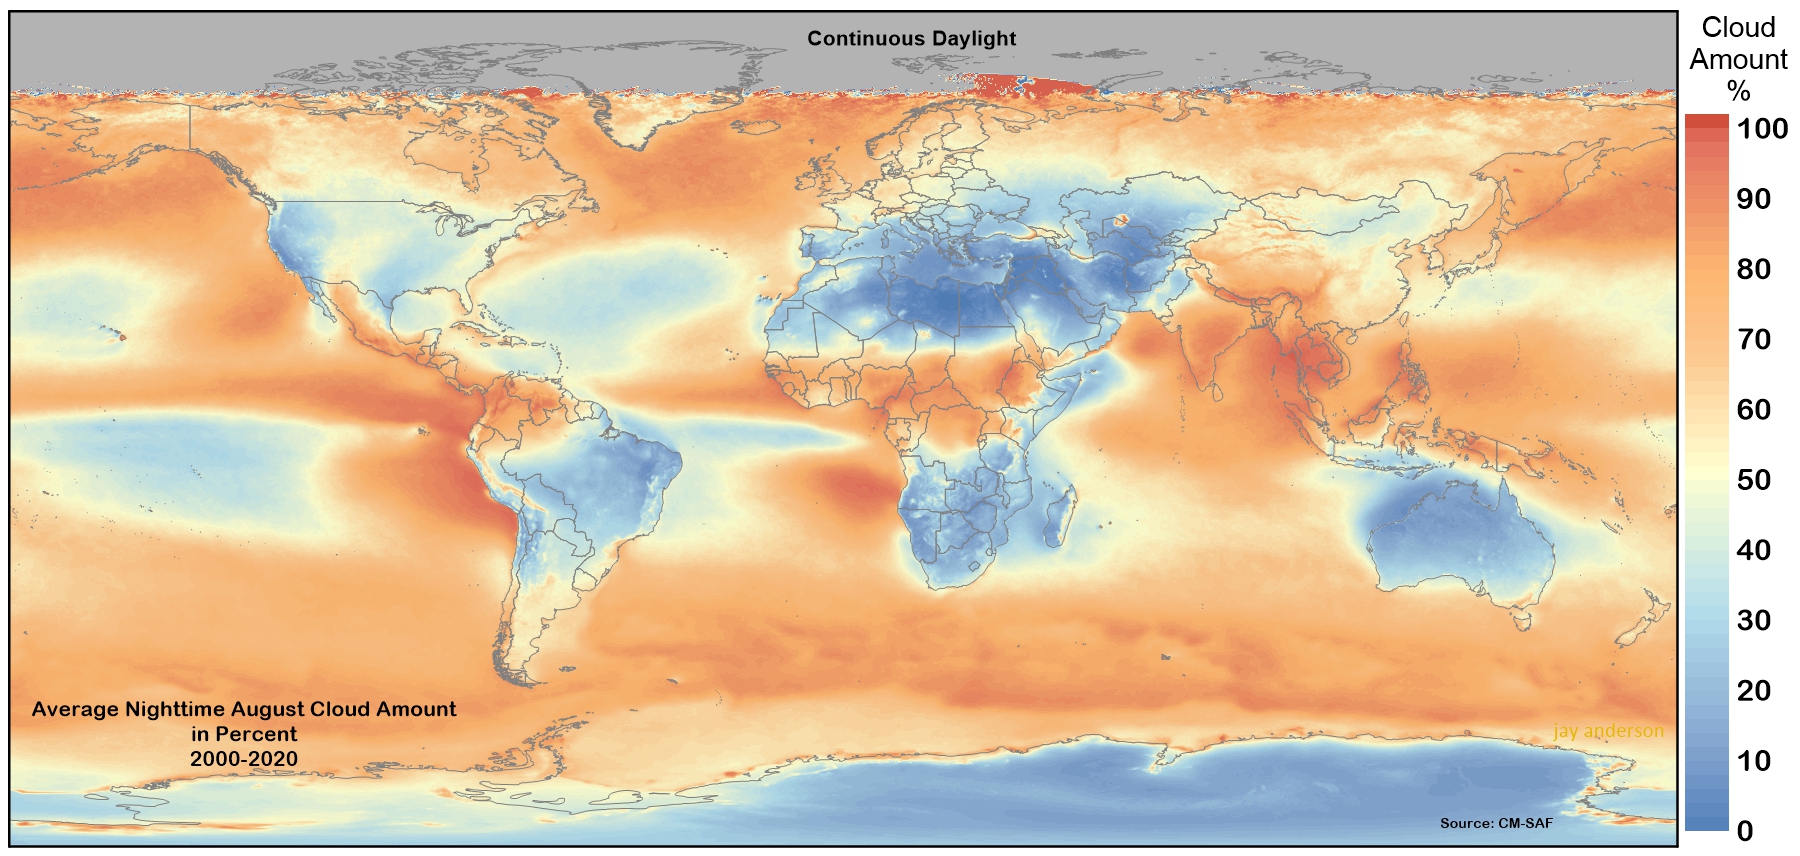 |
September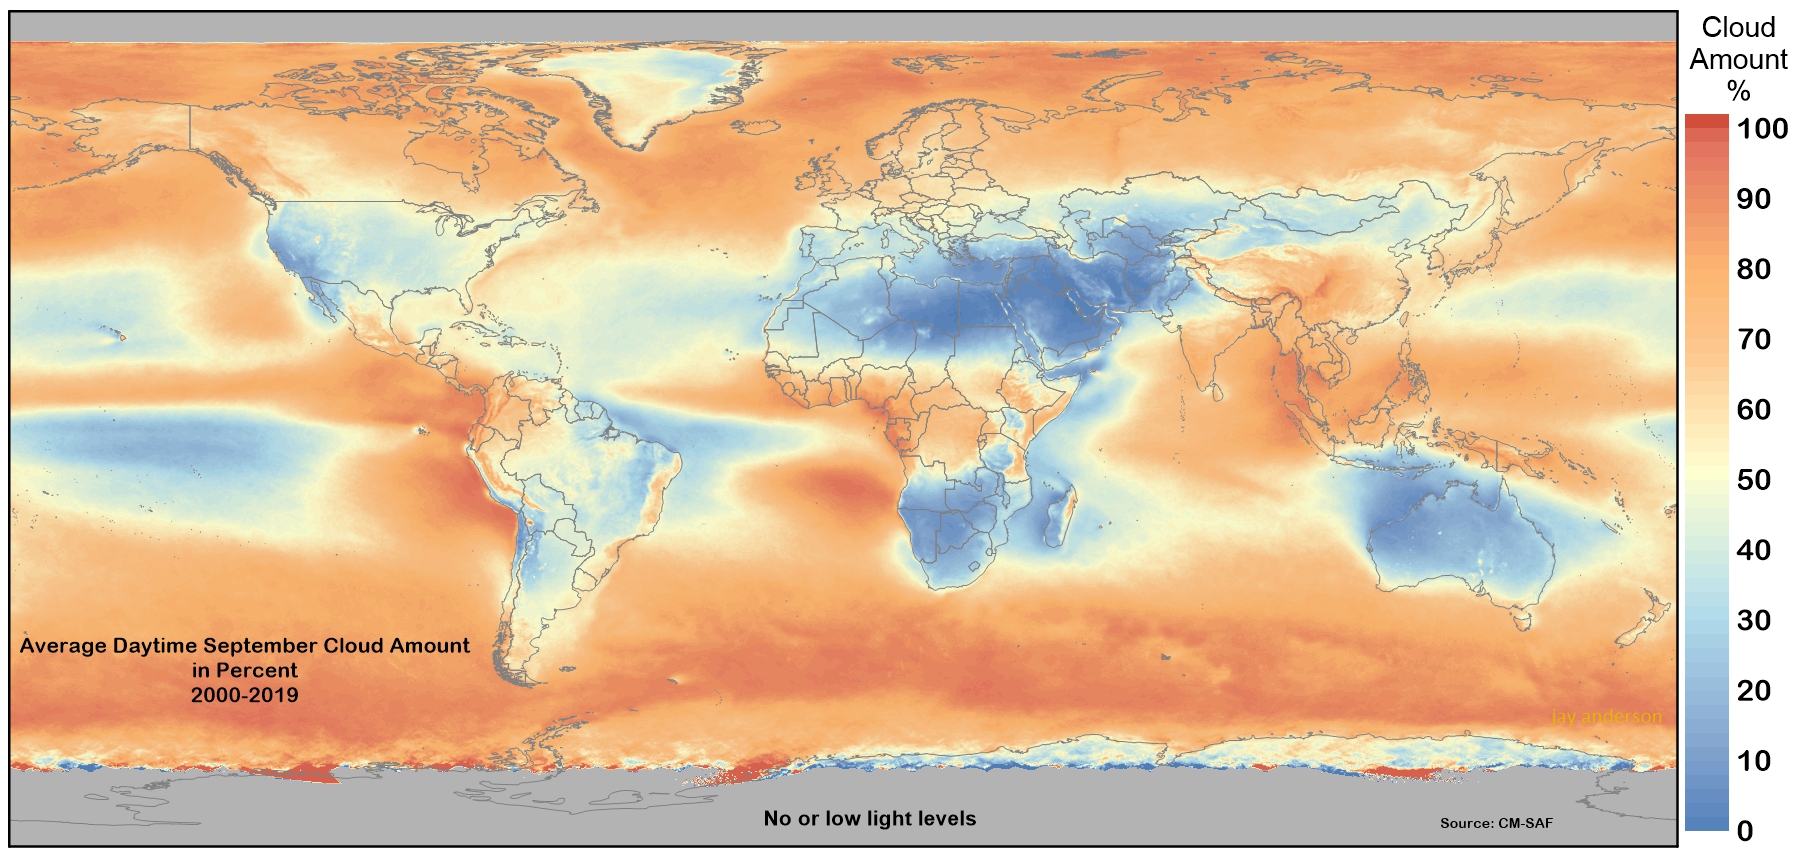 |
September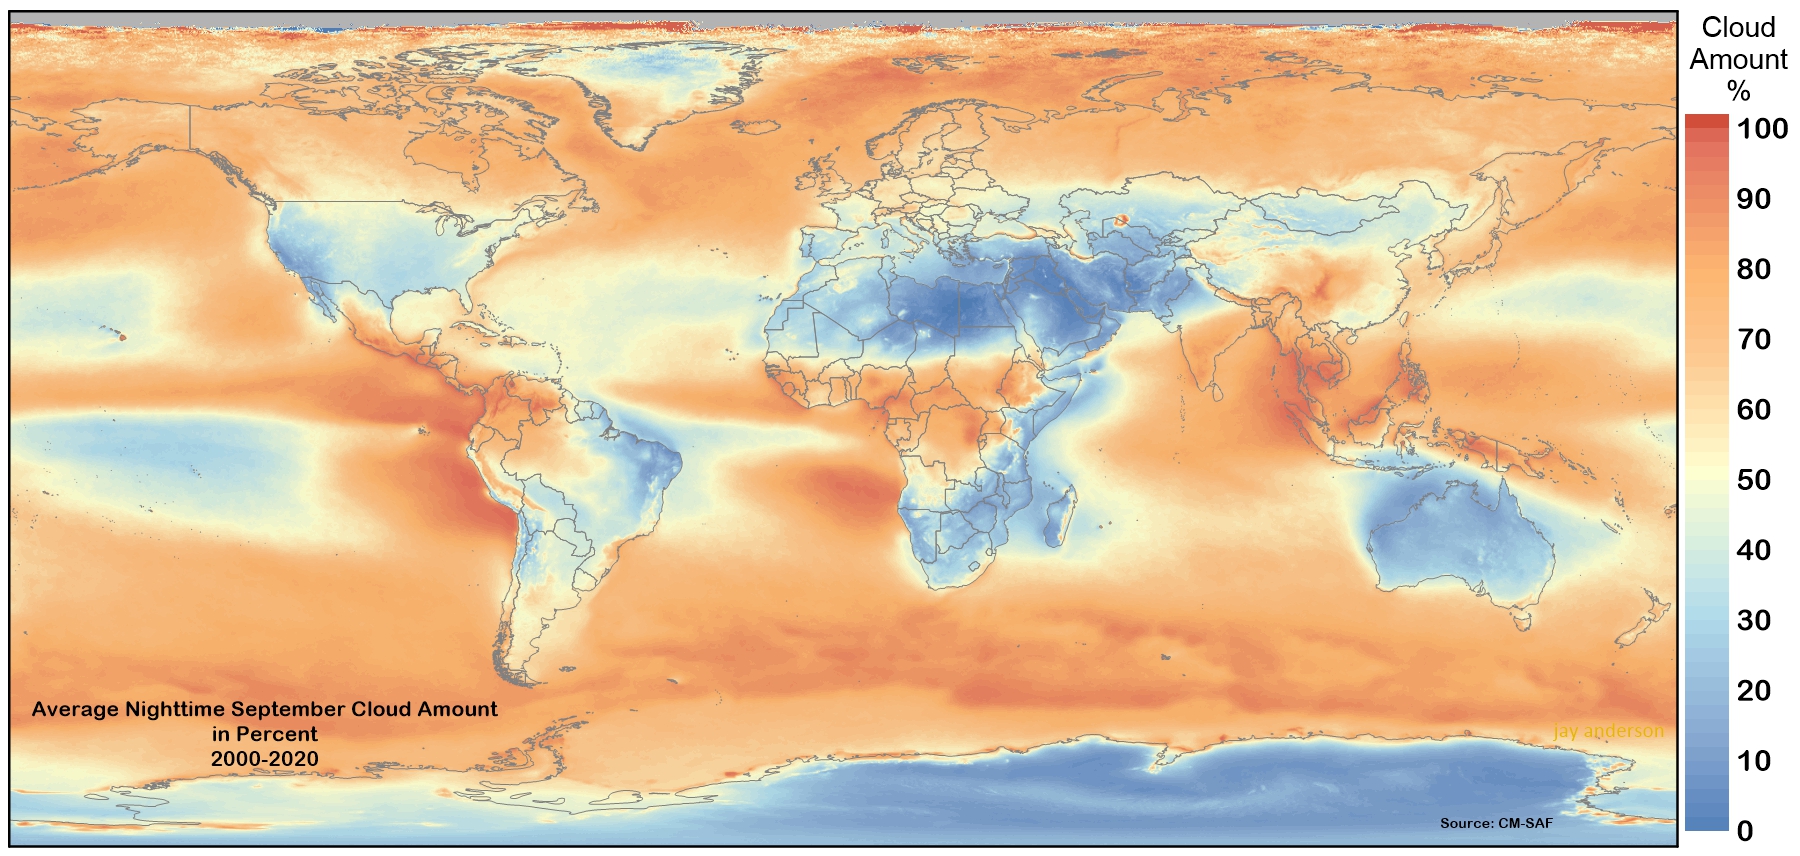 |
October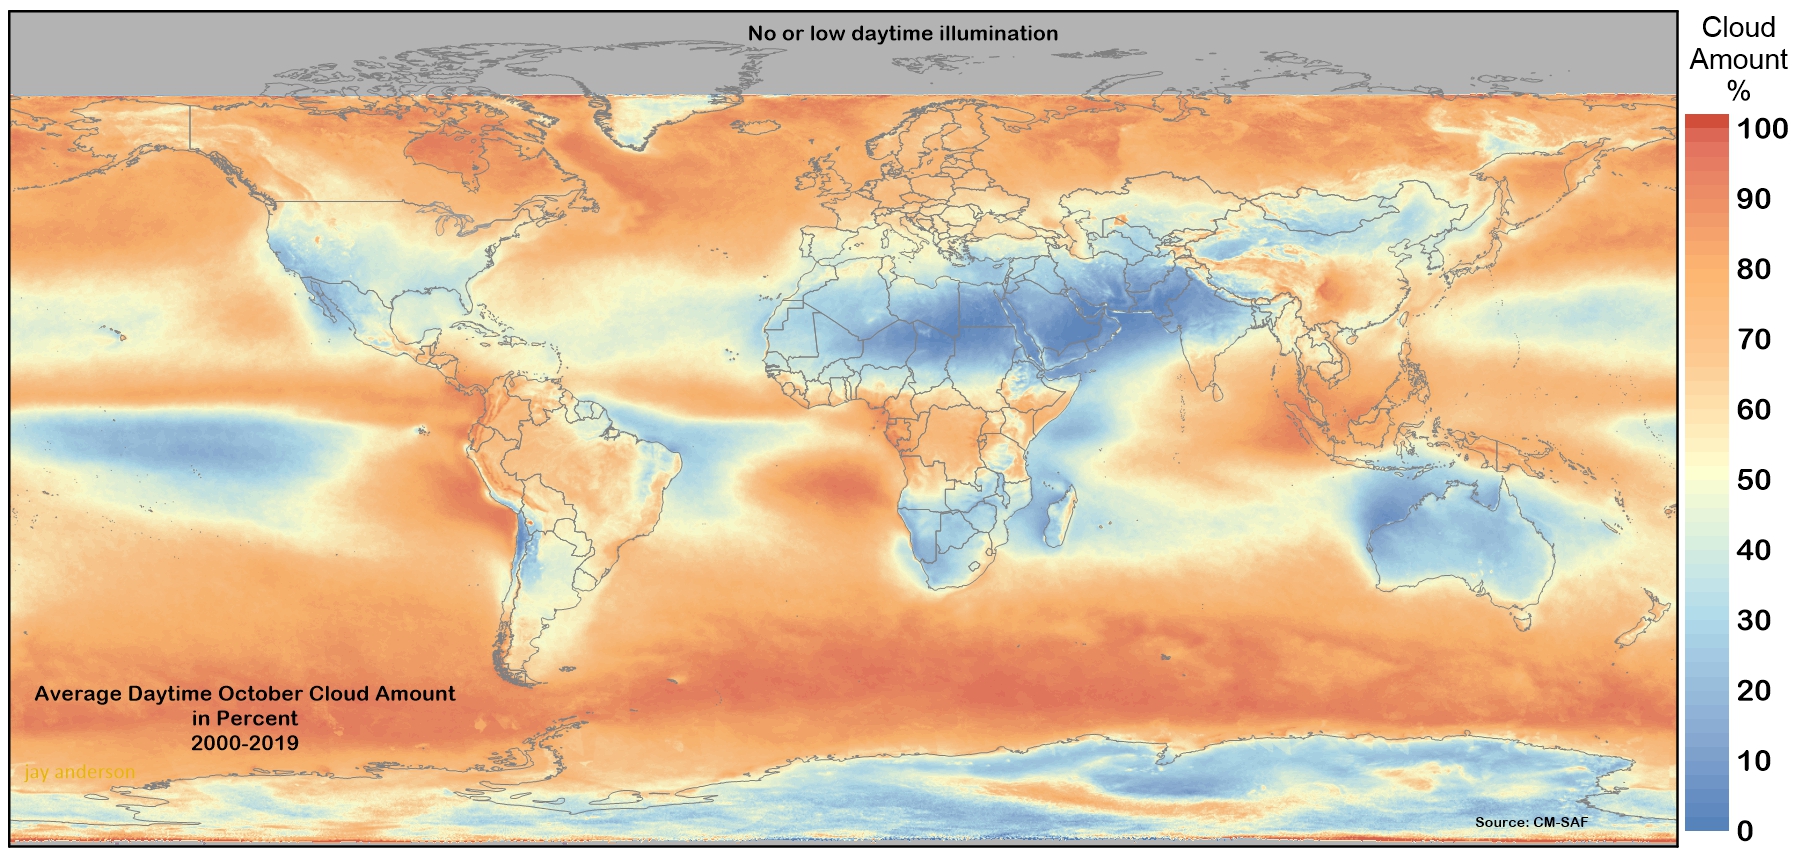 |
October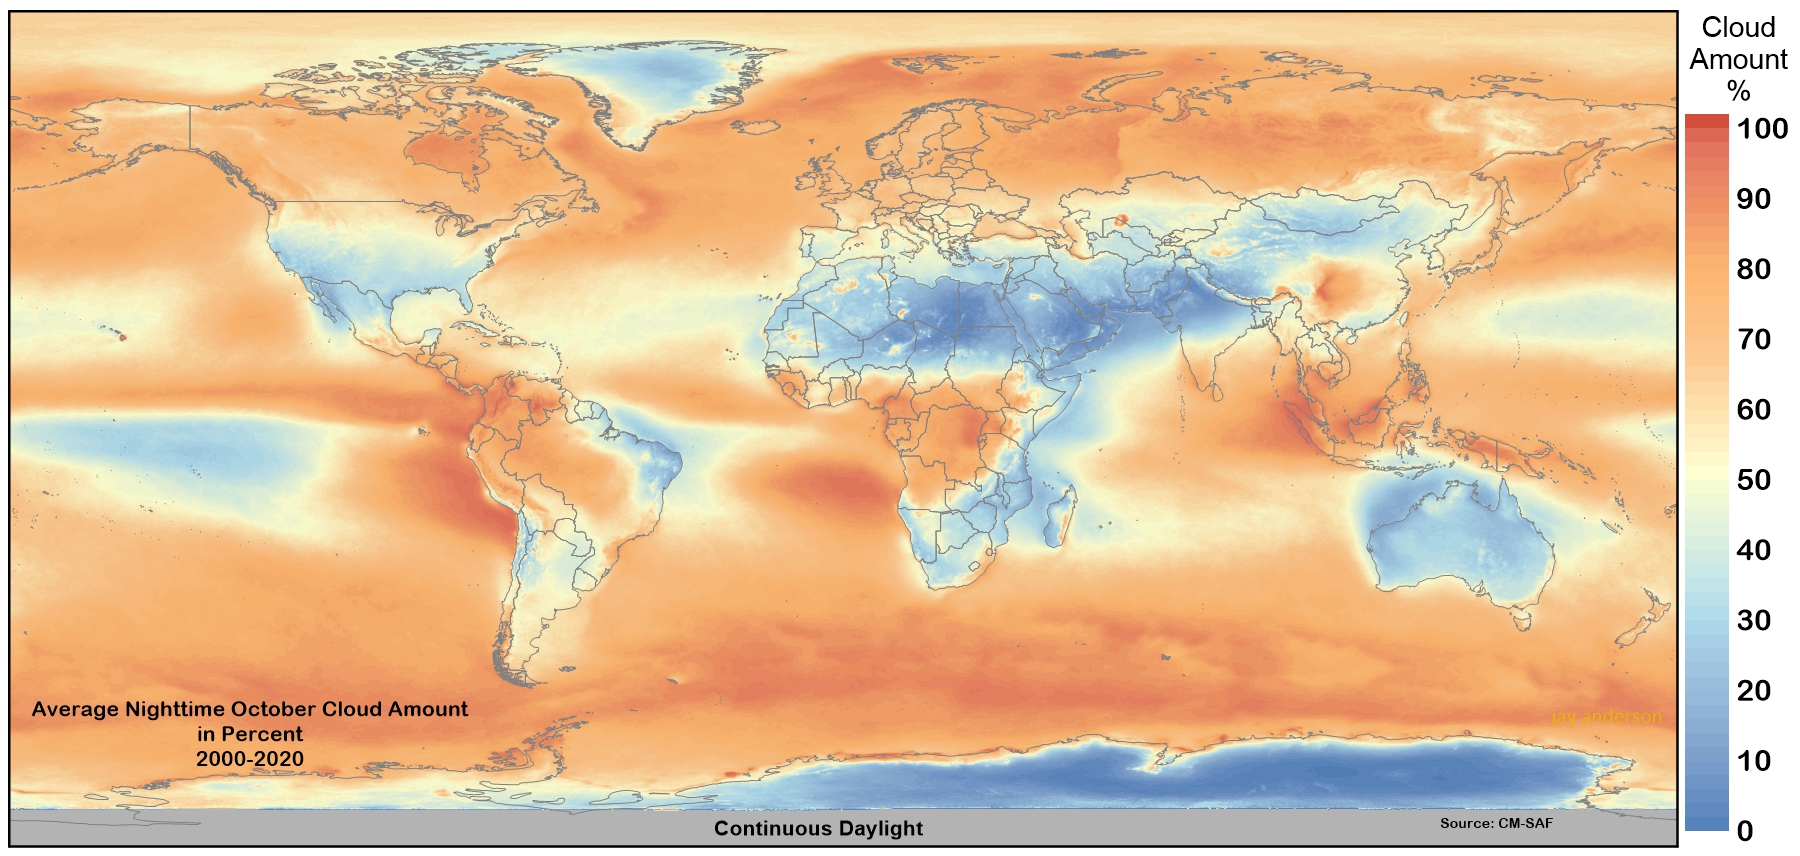 |
November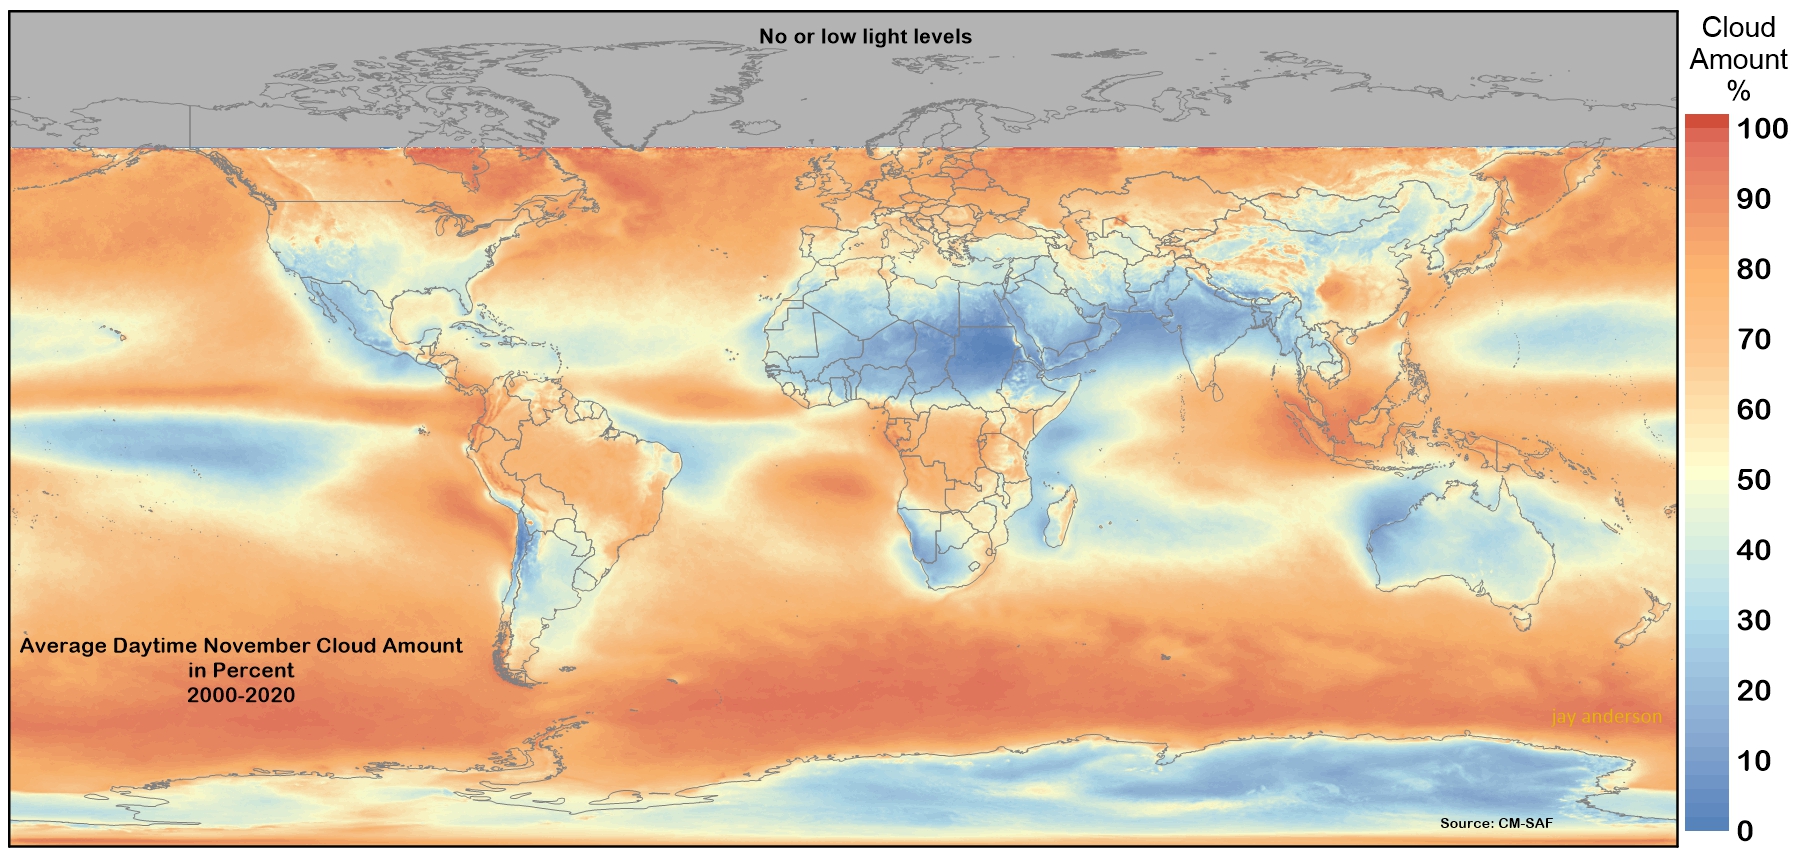 |
November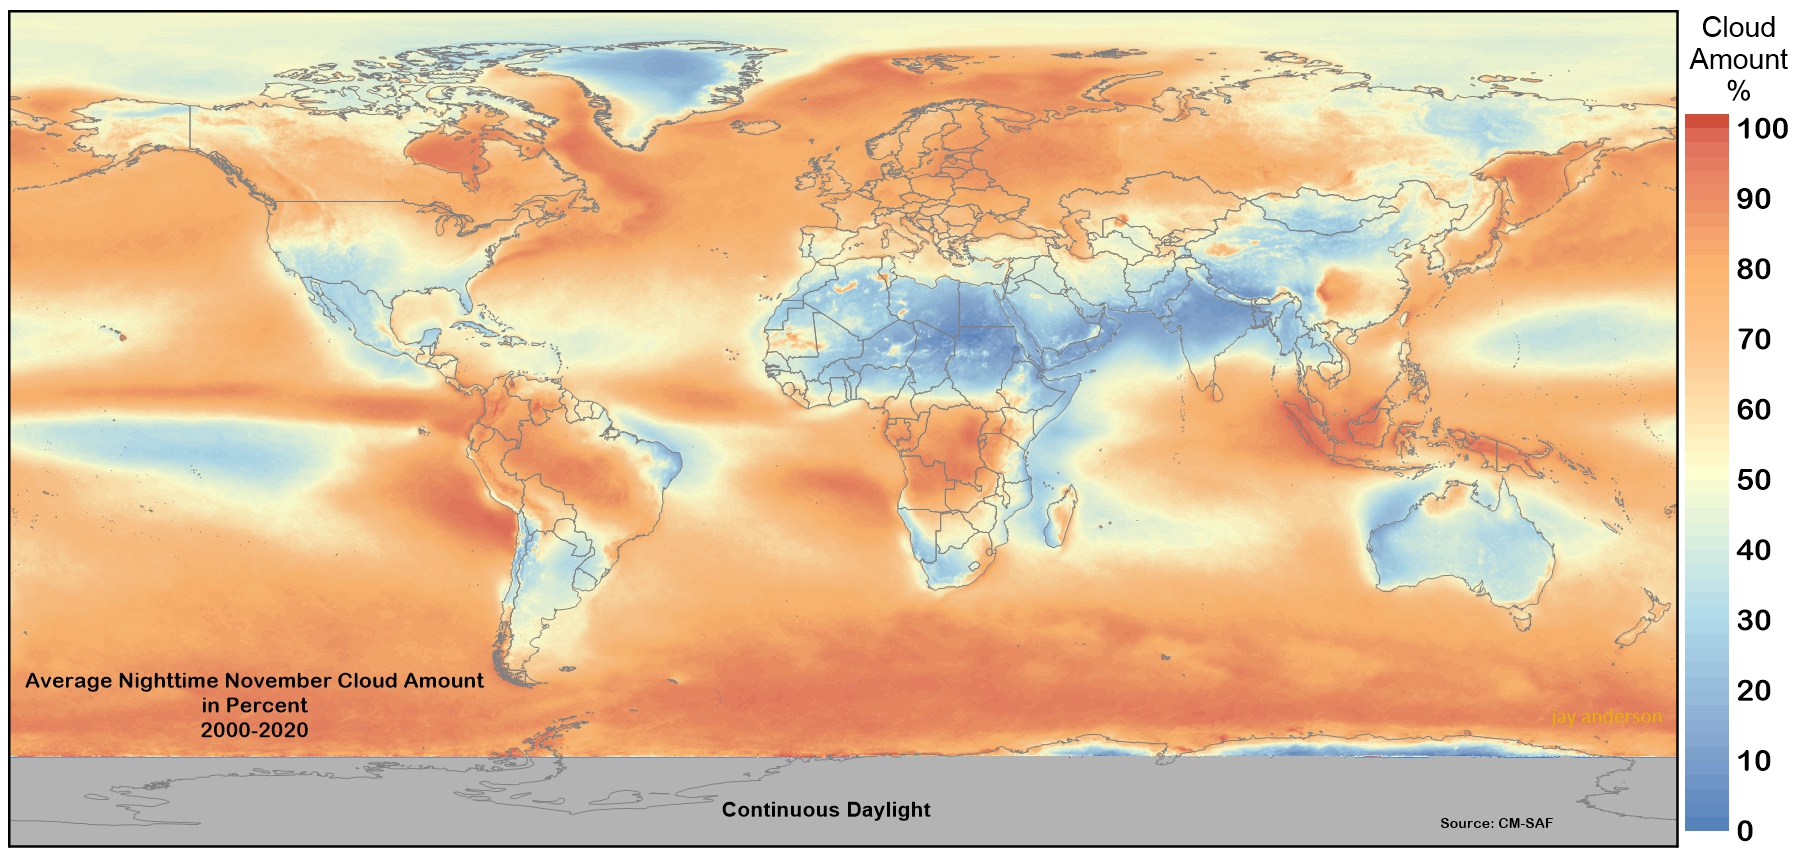 |
December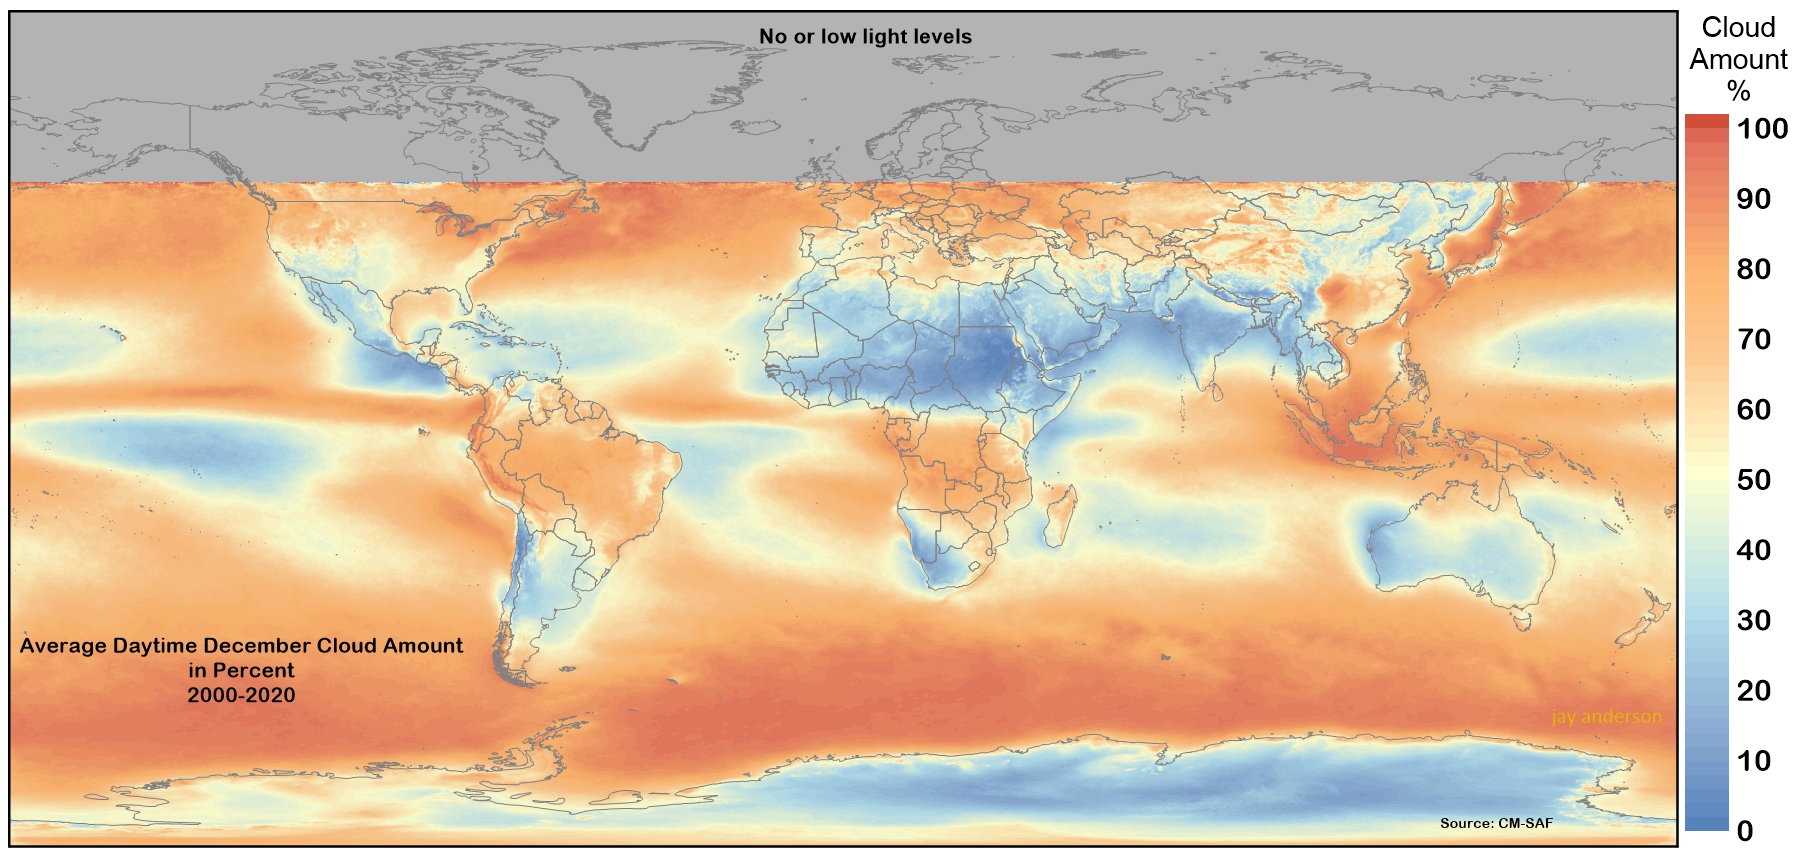 |
December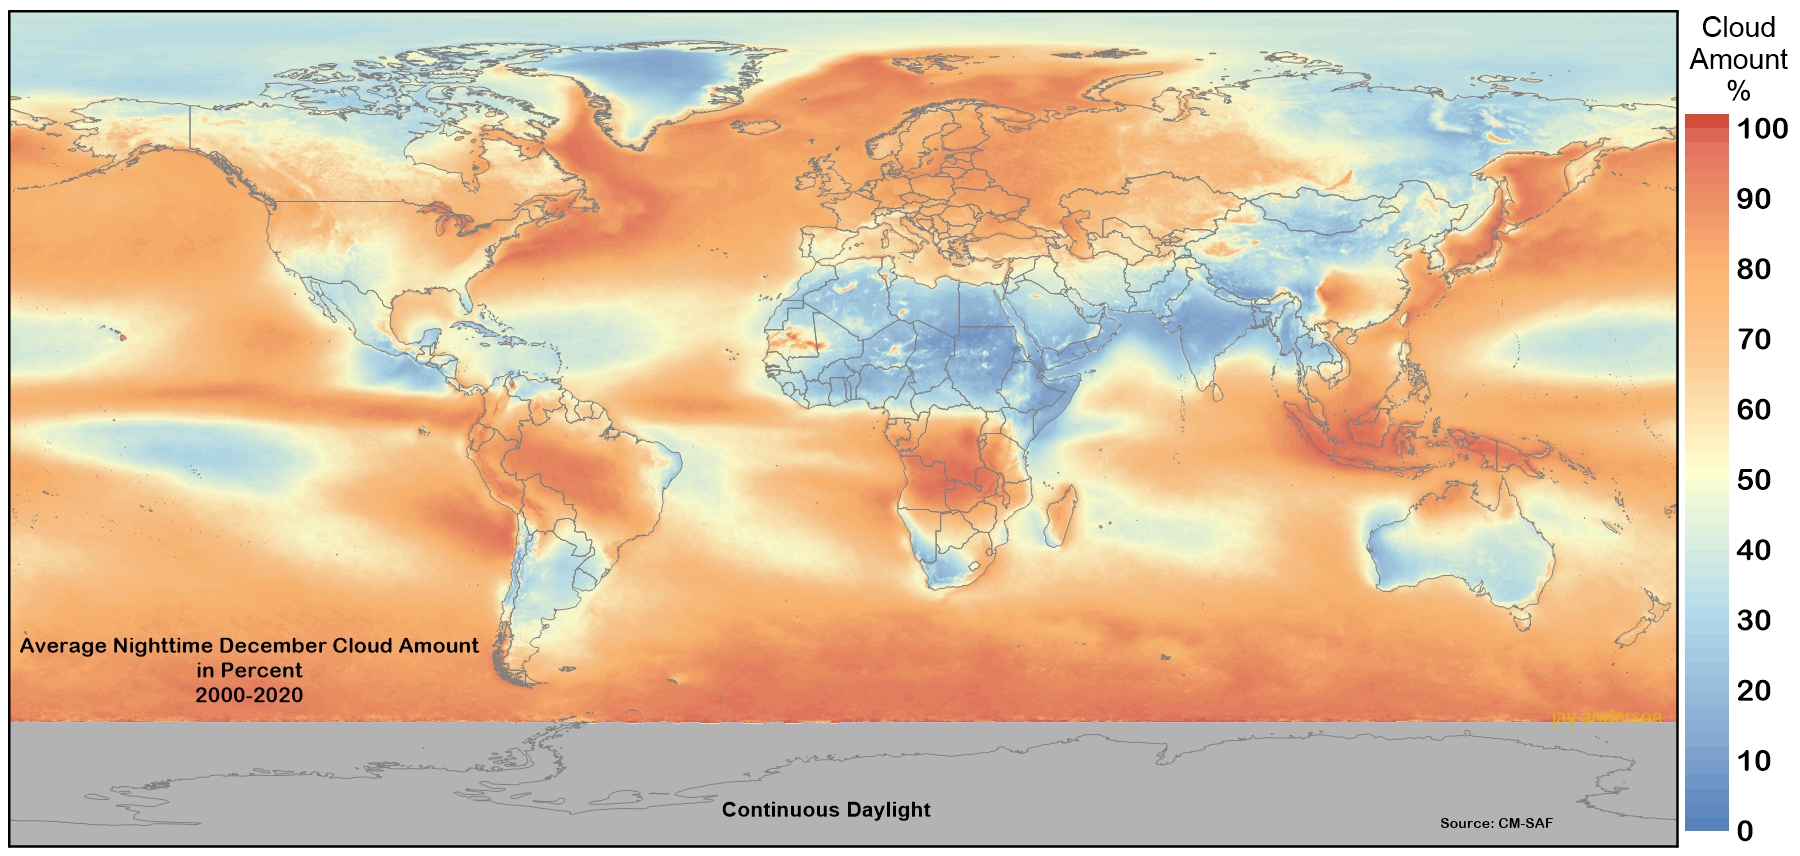 |
Movies
The following animations will show how global cloud cover changes through the year. To see the videos at full resolution, start the animation, then right click and select “Full Screen” or “New Tab.” The right click menu also has other useful functions such as change the playing speed or save the video.
Animation of nighttime cloud through the year.
Animation of daytime cloud through the year.
Updated July 2021