A lunar eclipse from a geostationary satellite
The 1986 lunar eclipse on October 17 was visible over most of Asia and Africa, but invisible from North America. The GOES 6 weather satellite, which overlooks North and South America, was able to see the eclipse above the limb of the Earth. GOES 6 made a scan of the globe every half hour, and the evolution of the eclipse was visible on three images.
Geostationary weather satellites scan the Earth in visible and infrared wavelengths. Visible observations were in deep red wavelengths; one infrared channel was in the thermal part of the frequency spectrum (10 to 12.5 um). Infrared radiation received at the satellite is strongly related to the temperature of the underlying surface and may be converted to equivalent blackbody temperatures. The infrared sensors on GOES 6 had an operating range between 160 and 330 K (-110 to 57°C). In the usual public image (seen on television weather reports), warm tones are dark grays and cold tones are light gray to white. Temperatures warmer than the sensor range are black; those beyond the cold limit are white.
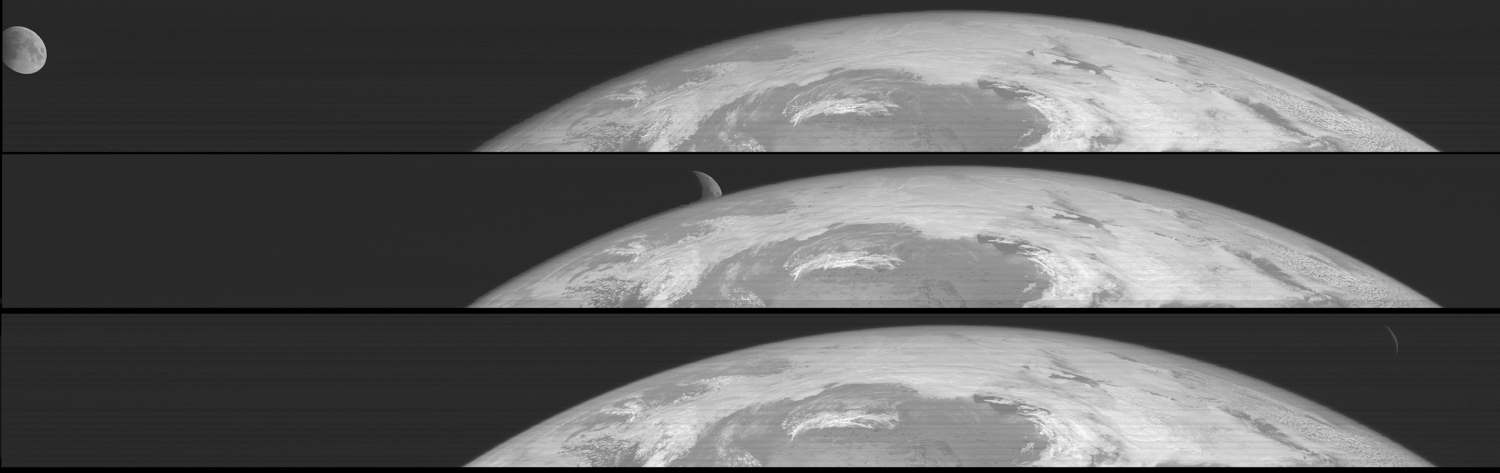
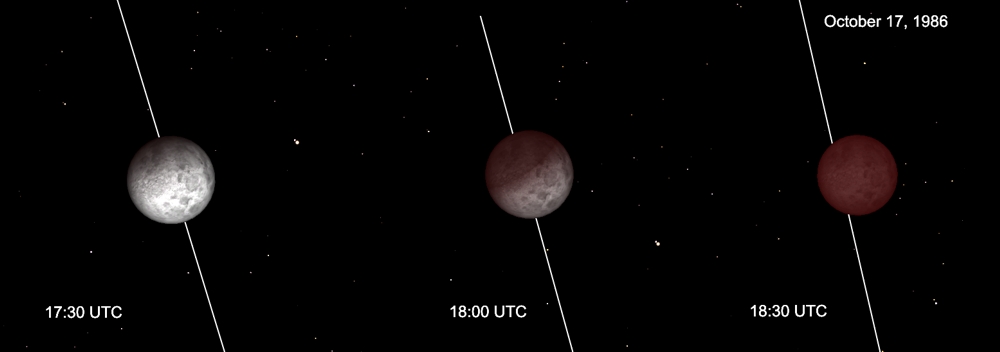
Figure 1 shows a sequence of visible-light images, at 1731, 1801, and 1831 UTC, in which the Moon moves from left to right past the disk of the Earth. Figure 2 is a depiction of the stage of the eclipse derived from the planetarium program StarryNight, at the time of each image. In the one hour duration of the images, the eclipse has gone from early totality to complete immersion in the shadow. In the bottom image, the fully eclipsed Moon is barely visible in the upper right.
In the infrared images, we can see the evolution of surface temperatures on the Moon as the eclipse progresses (unfortunately, the 1730 UTC image was corrupted). Figure 3 shows the infrared images at 1801 and 1831 UTC and Figure 4 shows an enlargement of all three visible and infrared images side-by-side.
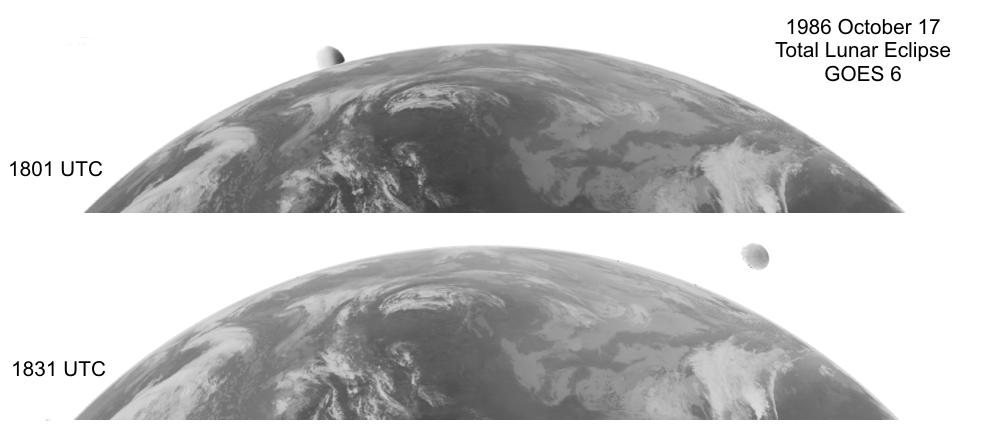
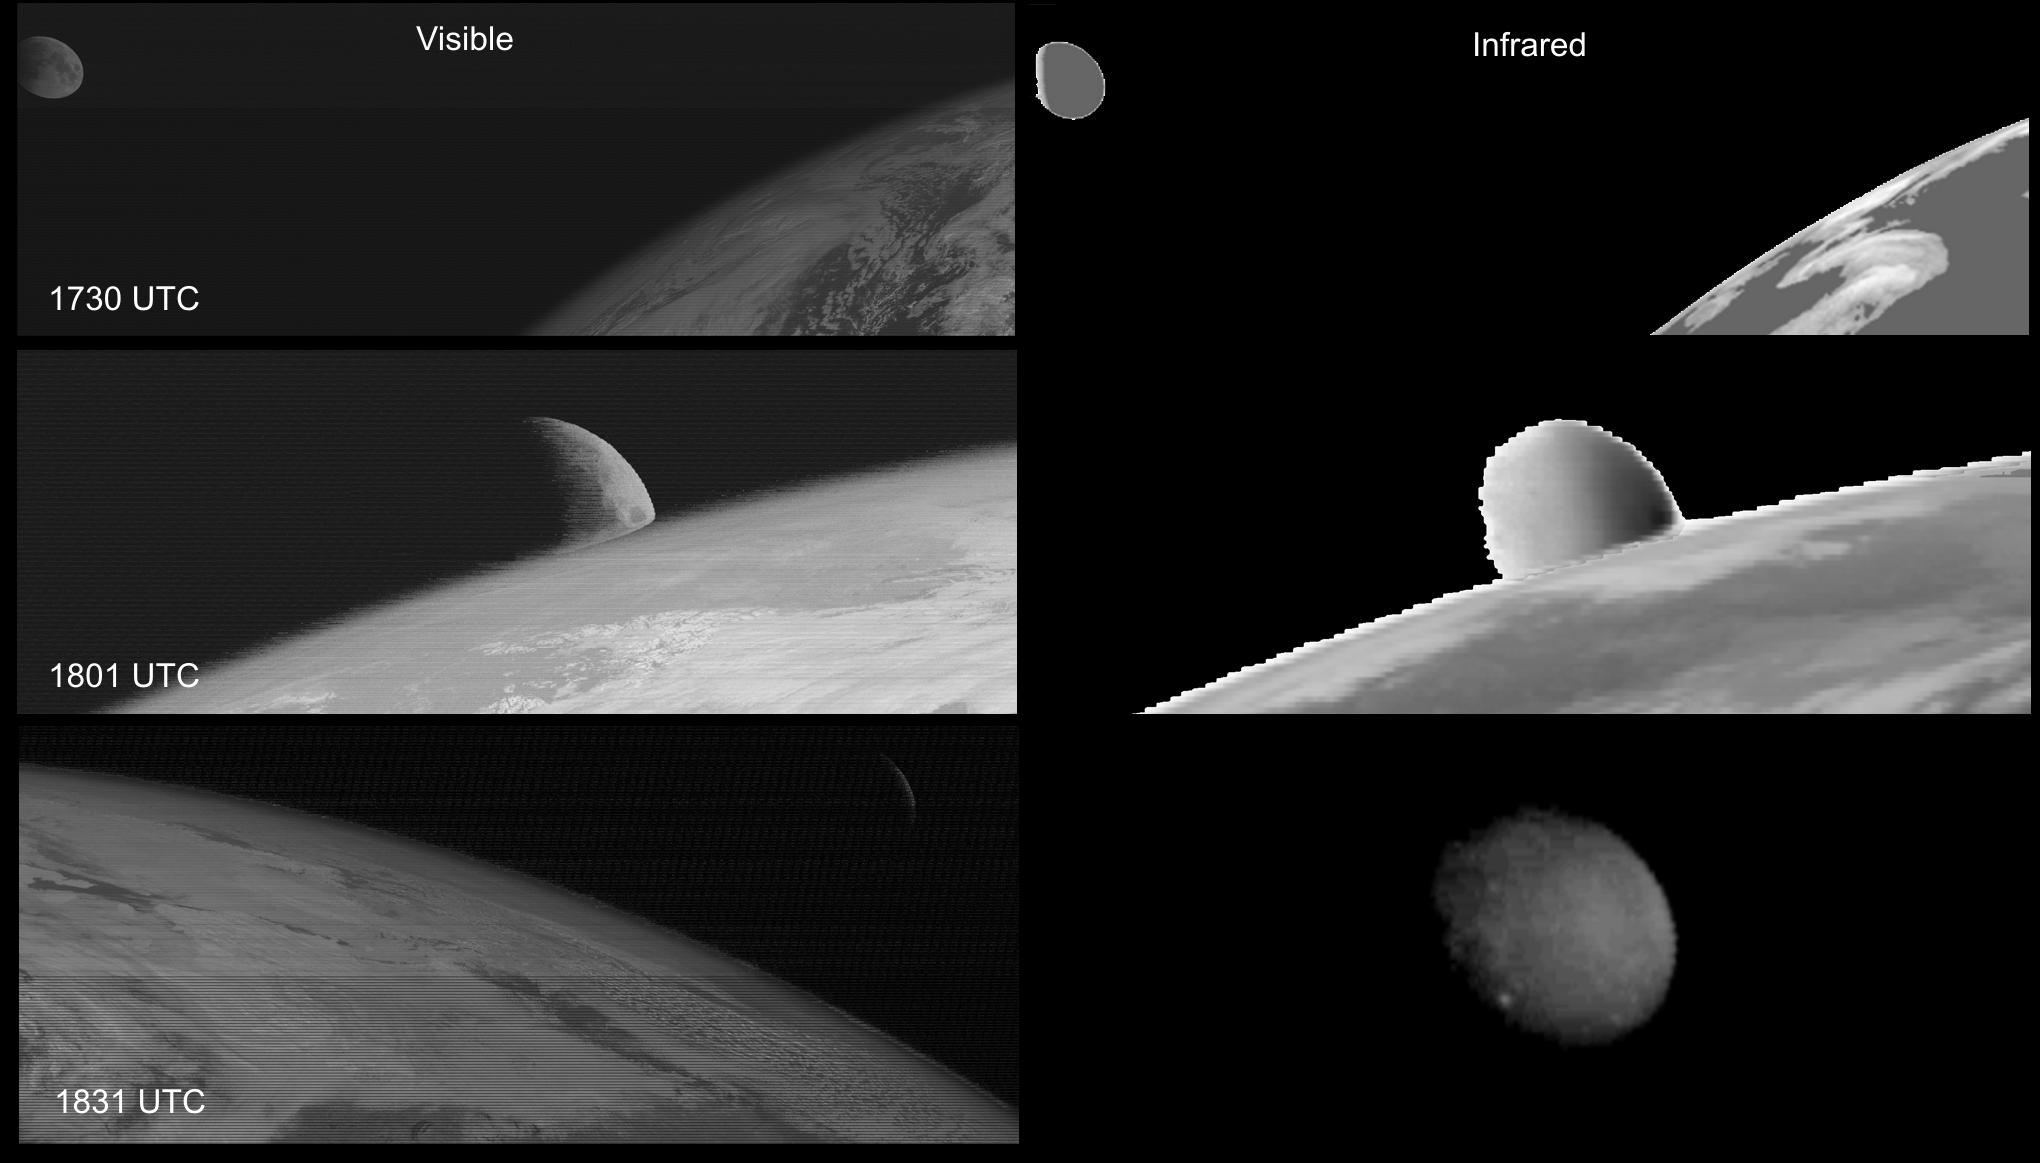
At the start of the eclipse, the whole of the partially illuminated surface of the Moon exceeded the maximum limit of the satellite’s thermal cameras and the lunar image was completely black, even though the western edge would have started to cool. In the 1801 image, the lunar surface has cooled sufficiently that its thermal radiation falls into the range that can be observed by the IR cameras. There is a gradient across the disk, as the warm (black) side is still exposed to a part of the Sun, while the cold (left) side has had nearly an hour in the shadow to cool.
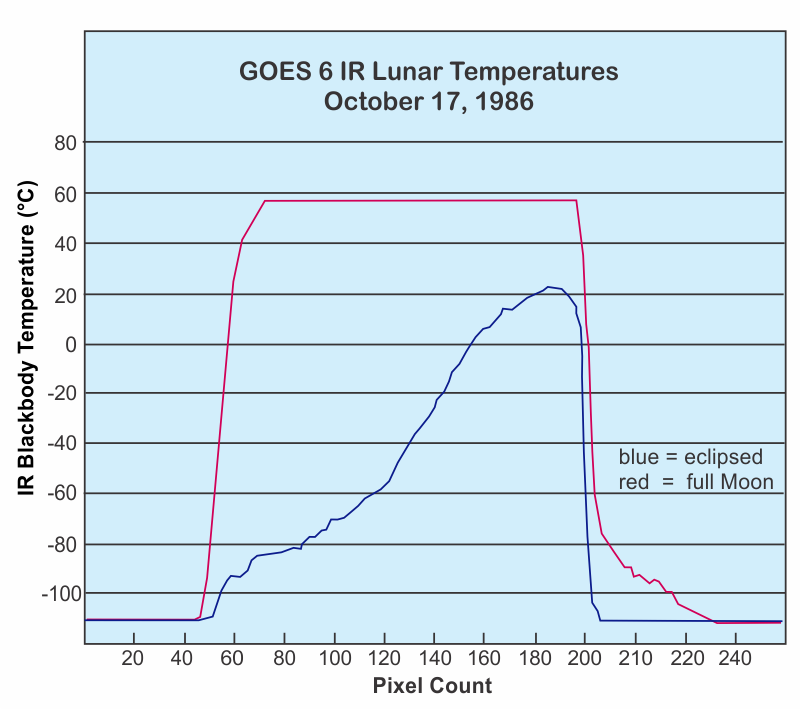
A temperature profile taken across the Moon at this time (Figure 5) shows temperatures around 22°C in the sunlight, while the shadowed limb has fallen below the -110°C limit. In fact, the eastern edge of the Moon fades into the infrared background chill of space (the infrared images of Figure 4 have had the background changed to black).
The infrared image at 1831 UTC is perhaps the most interesting, as it shows considerable thermal structure on the lunar surface, including an intriguing cold spot deep in the Earth’s shadow which seems to be the crater Tycho.
Infrared and visible-light images were traditionally combined to form a false-colour image by assigning the visible frequencies to red and green and the infrared to blue. Such an image, for 1801 UTC, is shown in Figure 6.
While images of the Moon over the limbs of the Earth are common in the history of GOES satellites, this is the only incidence found so far where a lunar eclipse was underway.
For a more technical discussion, see Anderson, 1987.
Updated December 2020