Total Solar Eclipse
2028 July 22
Australia
Geography along the eclipse track
Australia is a continent of exotic contrasts. From a geographer’s point of view, it’s a relatively flat landscape, excepting a 3,600 km long cordillera—the Great Dividing Range—stretching along the Pacific coast from Melbourne in the south to Cairns and beyond in the north. This Dividing Range reaches an altitude of 2,228 m at Mt Kosciuszko in New South Wales, but along the eclipse track, elevations top out at around 1,200 metres.

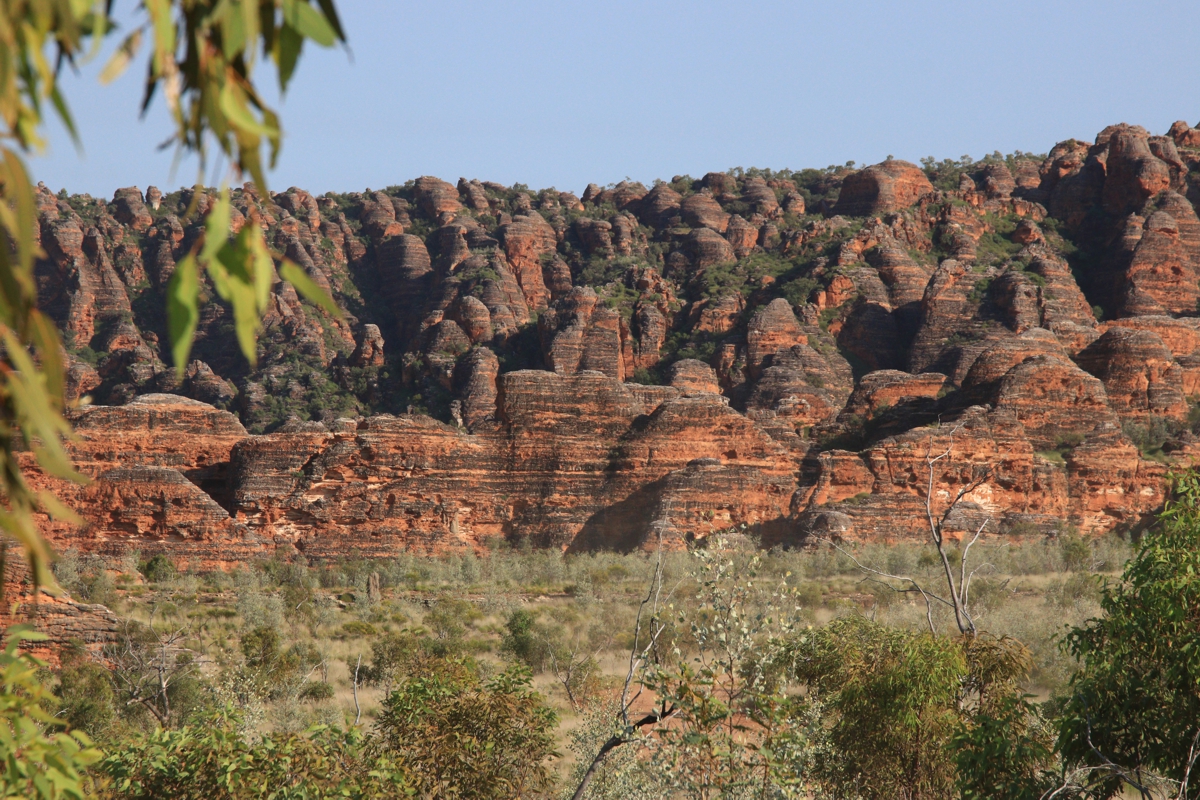
The track first comes ashore on a rocky, rough-and-tumble landscape that is all but inaccessible from land. A short distance inland (about 70 km on the centreline) the shadow moves onto the Mitchell Plateau, a somewhat friendlier landscape that is criss-crossed by rough back-country roads. For eclipse adventurers, the legendary Gibb River Road will take you 150 km to the eclipse centreline (and nearly to the maximum eclipse point) from its turnoff on the Great Northern Highway west of Kununurra. For less onerous travel, you can take the paved Great Northern Highway past Doon Doon Station to the eclipse axis, though there’s not much adventure along that route. If world-class scenery matters and you have a 4WD vehicle, turn off of the Great Northern Highway to the Bungle Bungles in Purnululu National Park, though you’ll take a penalty in eclipse duration.
The Australian Outback has no settled definition. Sometimes, it’s just away from big cities; at other times it’s where the rainfall is less than a certain amount. What is certain, is that a short distance after crossing the coast, the Moon’s shadow is in the Outback, an immense region divided into enormous cattle and sheep stations, magnificent national and state parks, and numerous Aboriginal communities, with few hard-surfaced roads to connect them all. In some parts, the terrain is open, with desert and dryland vistas, but travellers soon find that short excursions off of the sealed roads may introduce them to captivating canyons and red-toned geological formations, of which the Bungle Bungles are probably the best known.
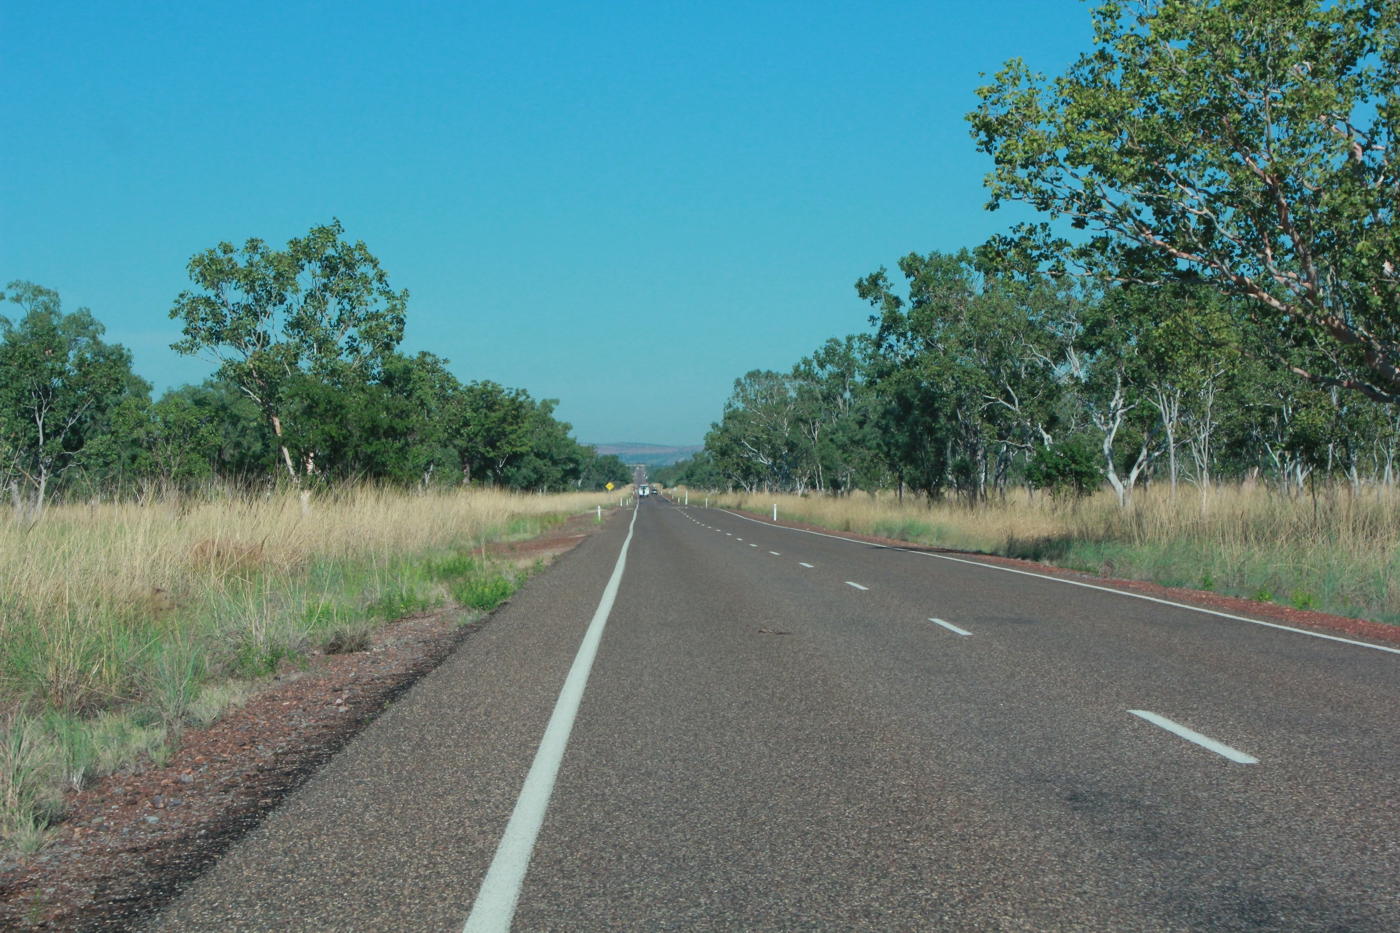
The Outback is also a territory of scattered settlements and a few modest towns. Sealed (paved) roads are limited; much of the territory is accessible by tracks that recommend 4WD vehicles and skills in coping with rough roads, water crossings, bull dust, sand pockets, and long stretches without fuel depots or accommodation. In short, it’s a marvellous, largely untouched part of the globe that rewards the more adventuresome traveller. As the signs say, “Gravel road. Drive to prevailing road conditions.”
As the track leaves the Northern Territory and moves into Queensland, South Australia, and New South Wales, the terrain flattens, revealing a horizon-to-horizon landscape with barely a ripple to scale the view. From Bedourie to Thargomindah, it’s an easy eclipse-viewing vista, though perhaps short of drama.
About 2,500 km along, shortly after the track passes Bourke, elevations begin to rise as the shadow approaches and then surmounts the Blue Mountains (a regional piece of the Great Dividing Range) before descending into Sydney on the Pacific coast. The Blue Mountains are not particularly high as mountains go, but for the eclipse seeker, they have an important influence on weather prospects, both good and bad.
Once over the mountains, the shadow track is back to an ocean setting, landing on the narrow coastal plain at Sydney and it’s surrounding suburbs. The plain is only 10-50 km wide and so onshore ocean winds have a steep uphill climb when they encounter the land. By the same token, however, westerly winds descend from the same heights, so that a change in wind direction can make a considerable difference in weather.
Australian climatology for the eclipse
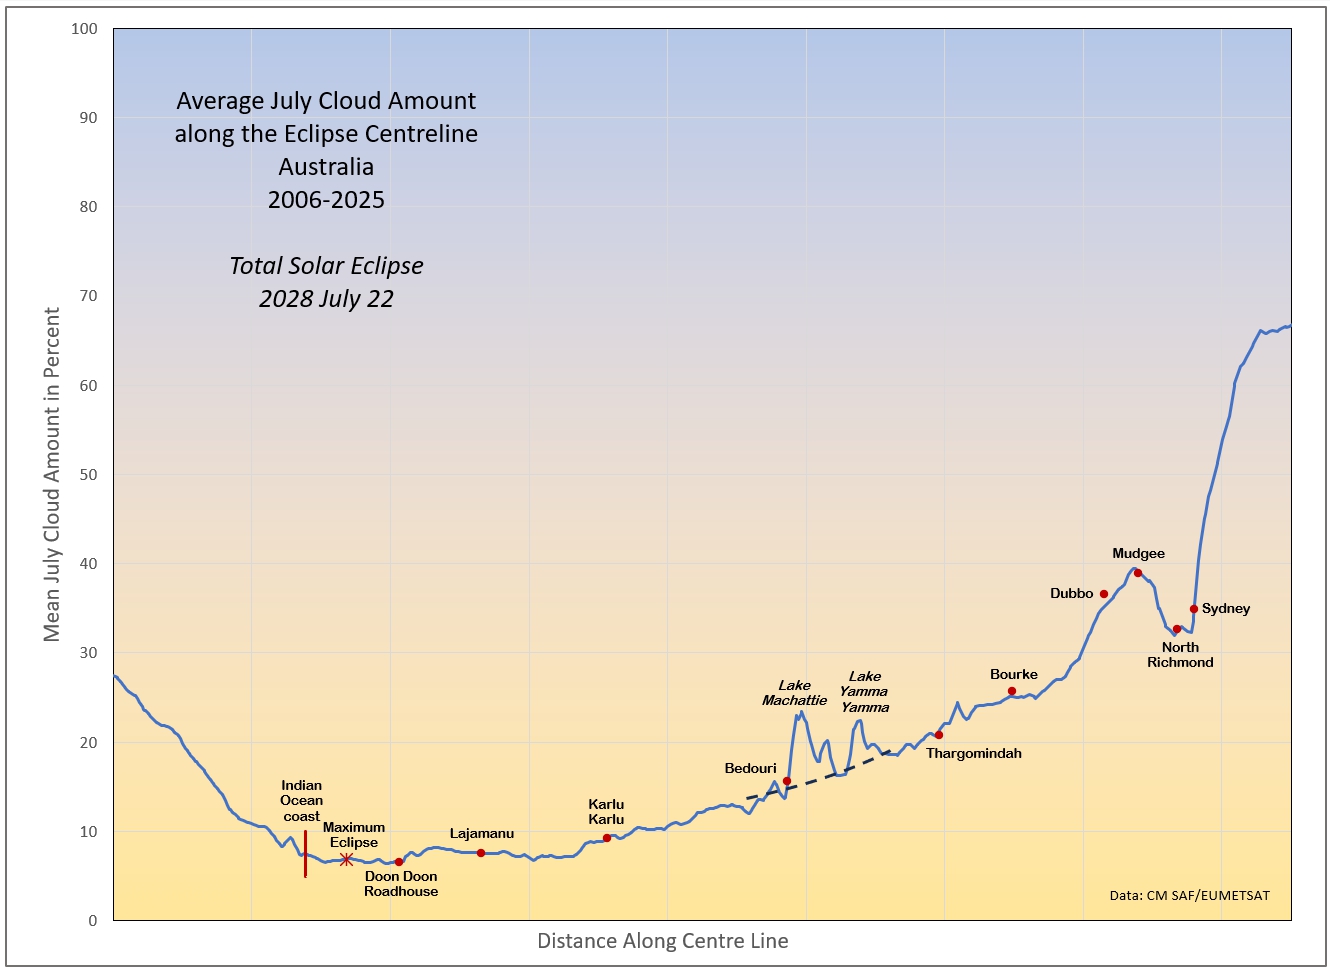
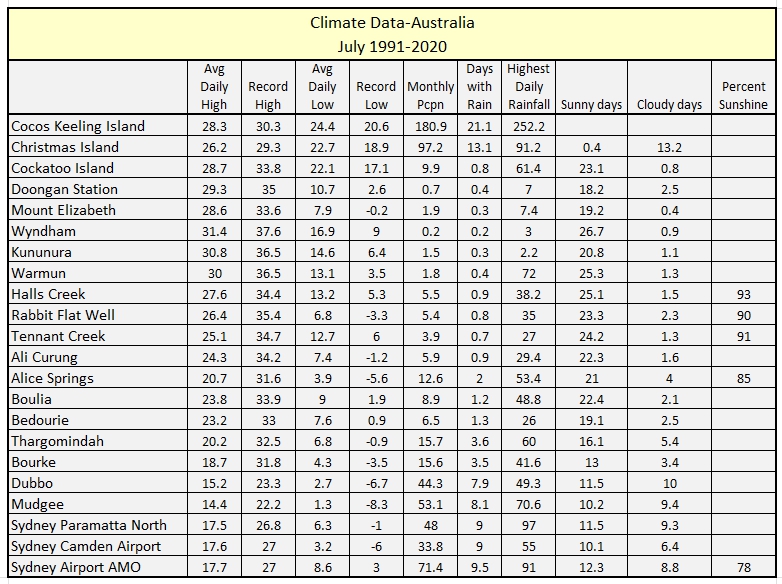
The 2028 eclipse comes during Northern Australia’s dry winter season and weather prospects are excellent to very good on the west side of the Great Dividing Range and fair to middling on the Blue Mountains and the Pacific coast (Figure 2). Satellite-based observations show average July daytime cloud amounts along the centreline that never climb above 40 percent (Figure 3). Best of all, from the Indian Ocean coast in Western Australia to Karlu Karlu (aka Devils Marbles), where the Stuart Highway crosses the track, satellite-measured cloud amounts remain below 10 percent. Though limited, weather-station solar measurements are equally generous, with sunshine bathing more than 93 percent of the daytime hours at Halls Creek, and in the upper 80s percent at Rabbit Flat and Alice Springs. These stations lie south of the eclipse track, but Figure 2 and the sunshine measurements at Tennant Creek (Table 1) suggest that the frequency of sunny daytime hours on the track is above 90 percent in this part of the Outback.

A substitute for sunshine records is available in the weather station measurements of sunny and cloudy days, shown in Table 1. Cloud is estimated in oktas or eighths of the sky cover. Sunny days are those in which the cloud cover is equal to or less than 2 oktas; cloudy days are those with 6 or more oktas of cover. All values are the average of a mid-morning and mid-afternoon observation. Values in between 2 and 6 are partly cloudy days. All-in-all, there is good agreement between all of the estimates of sun and cloud in the records.
Beyond Karlu Karlu, there is a slow climb in cloudiness, rising to an average of just under 40 percent at Mudgee and a little higher off the centreline toward the south side of the path. The cloud graph in Figure 3 shows two peaks east of Bedourie, labelled Lake Machattie and Lake Yamma Yamma, rising to about 25 percent, but these are artifacts caused by the bright salt lakes in the area that are occasionally mis-identified as cloud in the satellite algorithms. The dashed line shows a more likely cloud trend. There are several other bright spots, scattered around Australia in Figure 2.
The rising cloudiness as the track trends southeastward arises from the move to lower latitudes where winter weather systems begin to have a significant impact and where the influence of the Blue Mountains can be felt. For the most part, any passing weather disturbance will have heavier, thicker, and longer-lasting cloud cover and heavier precipitation as it encounters the mountains, a feature evident in the records for Dubbo and Mudgee. Even so, it is a bit surprising that the mountain influences are only able to raise the average July cloudiness to between 35 and 50 percent beneath the eclipse track, a testimonial to the overall dryness of the continent at this time of year.
A short distance after the shadow passes Mudgee, it begins to descend the eastern slopes of the Blue Mountains, arriving in the western suburbs of Sydney. The graph in Figure 3 shows a drop of about 8 percent in average cloudiness on the centreline as the elevation falls, reflecting the tendency of sinking air to dry out as it descends mountain slopes. As the centreline reaches the coast, just north of Sydney Airport, cloudiness creeps upward a few percent, responding to the presence of the Pacific Ocean.
Eclipse visibility at Sydney is complicated by its marine climatology and the nearby Blue Mountains. The oceanfront location provides plenty of moisture and the mountains are often the source of mid-level wave clouds carried by the prevailing westerly flow. Cool winter days make the atmosphere unstable and prone to convective clouds in the afternoons. The upshot is that the cloud cover in Sydney is often highly variable across the city. When I examined the July 22 satellite images between 2000 and 2025 for the amount and type of cloud between the Sydney Opera House and the airport at Botany Bay, 9 days were clear, 5 were overcast, and on 12, skies were open at some point in the 13 km between the two sites. Though it’s probably not statistically important, the Opera House area was slightly sunnier on eclipse day than the airport.
Sydney’s weather in 2028 could be much like Cairns in 2012, where some watchers saw the eclipse while others, only a short distance away, were disappointed by an unfortunate cloud that drifted across the sun.
What could go wrong?
Given the fine weather prospects for the eclipse. it’s tempting to be complacent about Outback weather, but history has recorded some extreme rainfall amounts along many parts of the eclipse track. The average July rainfall for Bedourie is a meagre 10.8 mm, but the record for the month is more than a dozen times higher at 137 mm in 1986; in 1968, 57 mm fell in a single day. In 2024, weekend rains dumped more than 50 mm of rain around Birdsville, turning the annual Big Red Bash music festival into a mud bath and bringing traffic to a halt. It’s not just the eastern side of the continent that can be inundated: Halls Creek in Western Australia recorded a 24-hour rainfall of 38 mm in 2010, which would cause significant problems for off-road travel. As these events are reasonably easy to see coming, attention to the forecast and a Plan B are prudent in the lead-up to the eclipse, especially when travelling in the Outback.
However, as Joe Cali notes below, Plan B’s come with their own problems:
Due to the population distribution, mobile phone and associated mobile internet coverage is sparse. Telstra and Optus have the two widest mobile terrestrial networks and most other carriers piggyback off one of these two networks. Coverage in remote areas tends to follow major highways or comes as spot coverage around settlements. But there are network deserts as well … and weather information in these can be difficult to access. Eclipse chasers need to be aware of the coverage maps for their provider. Telstra has wider geographic access than Optus at some of the remote highway locations (Kimberley and Karlu Karlu/Devils Marbles) and there is almost none once you leave the major highways. Eclipse chasers can manage by taking opportunistic access as they pass through zones of internet access. Be careful—a breakdown off highway can be disastrous.
Fortunately, the continent does not experience cyclones in July.
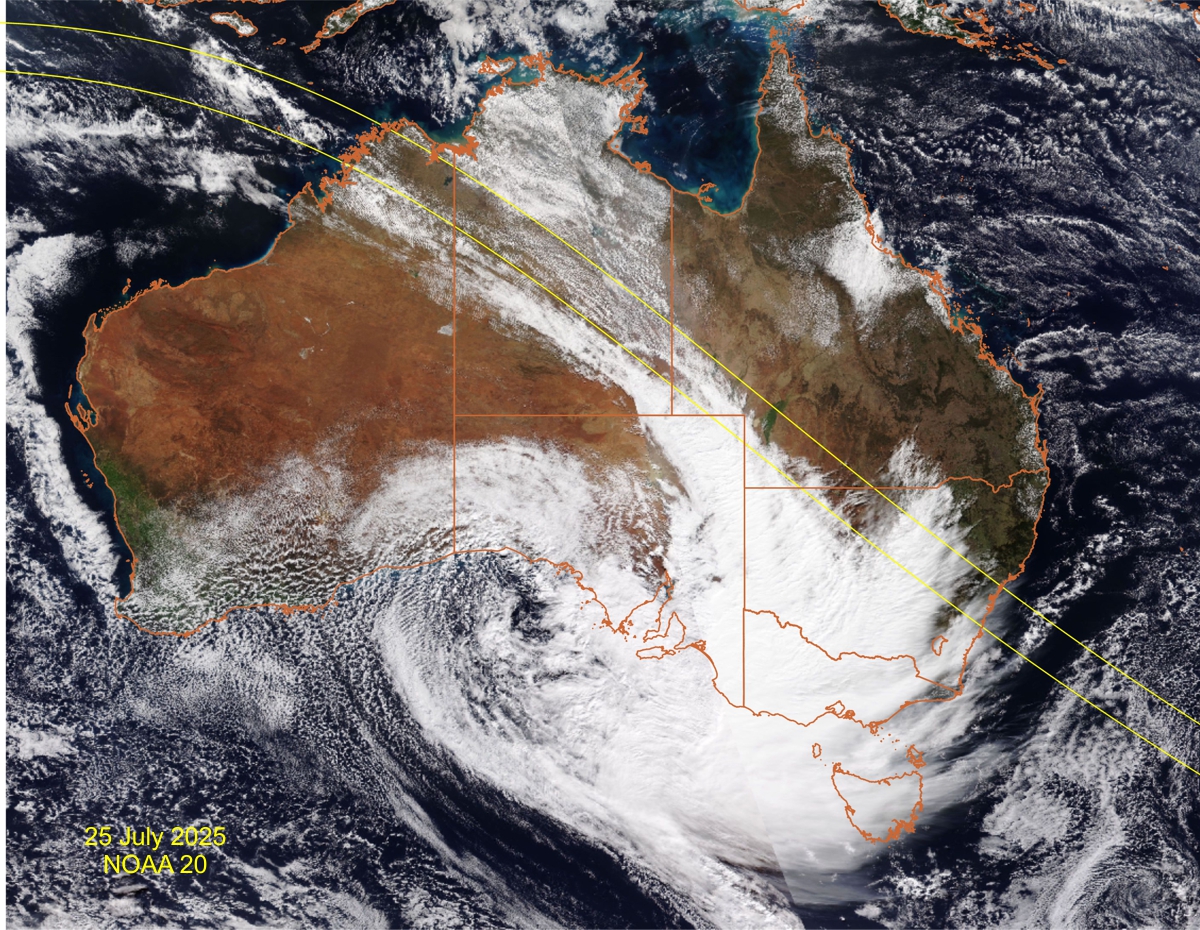
Low-pressure storms moving across the Great Australian Bight often bring damaging winds to southeast Australia, and if intense enough, well to the north, across the eclipse track in the tri-state area near Birdsville where Queensland, New South Wales and South Australia come together. Winds in excess of 70 km/h are not unknown across the eastern eclipse track – a value that was exceeded on July 25, 2025 from Thargomindah to Tennant Creek. Such winds in the Outback are also likely to raise dust.
Weather systems
In the middle of the southern winter, when the Sun is well to the north, temperatures in the Northern Territory reach their coolest values. The permanent high-pressure anticyclone that lies to the west of the continent in summer expands north and eastward, building a second high-pressure centre over South Australia and New South Wales. This anticyclone has a prominent presence in the July pressure pattern, but on a day-to-day basis, the high is subject to considerable displacement by mid-latitude lows that move past the continent over the Southern Ocean and the Great Australian Bight. In effect, weather patterns in July consist of a series of alternating highs and lows, with the high “squeezing” out of the way when a low-pressure storm comes by and then reforming in the low’s wake.
The average position of the sub-tropical jet stream in July stretches across the middle of the Australia at about 25° latitude, but it has a wide north-south range and often merges with tributary streams that carry separate weather systems. The flow of air above the continent is just as variable as that at sea level.
As a low approaches and the anticyclone erodes, cloud from the storm spreads inland, typically across South Australia, Victoria, New South Wales and southern Queensland. It’s these lows and their associated cold fronts that explain much of the cloud cover increase southeastward along the eclipse track. The Great Dividing Range adds to the cloudiness by hosting thicker and longer-lasting cloud cover and promoting the initiation of convective clouds on the mountain heights as the low-pressure systems with their instabilities go by. These storms are not systems that come and go quickly; more typically, they hang about for two to four days.
Farther north and west, over the Northern Territory and Western Australia, the remains of the displaced high-pressure anticyclone limit the intrusion of the bulk of the storm-system cloud, but associated cold fronts can occasionally stagger far enough north to reach the eclipse track, as seen in Figure 4. Because they are falling apart after a long trip over the interior deserts, they are usually, but not always, patchy and thin. Unfortunately, the frontal remnant sometimes aligns itself along the eclipse track, making life difficult for everyone.
Northerly tributaries of the sub-tropical jet stream are sometimes found over Western Australia and the Northern Territory carrying streamers of high-level cloud that stretch along the eclipse track. For the most part, this higher cloud is transparent and won’t completely block the view, but it will be annoying. These subsidiary jets can also be the trigger for the formation of larger and more organized cloud systems, but this seems to occur most often after they move eastward into Queensland.
This eclipse comes with a high probability of success, particularly on the Outback. With four other Australian eclipses due before 2039 (https://eclipsophile.com/future-eclipses-2027-2033/ and scroll down toward the bottom of the page), eclipse-chasing in the land of Oz is looking decidedly comfortable for the following decade.
The Australian Tropical Islands
Cocos Keeling Islands
The lunar shadow first encounters land well away from the Australian continent—on the tiny pair of atolls called the Cocos (Keeling) Islands (the double name comes from two historical names for the group: Cocos Island and Keeling Island).
Of the two atolls, only one is inhabited. Tiny North Keeling Island, about 36 km north of the larger atoll, is a national park (Pulu Keeling National Park) with restricted (and difficult) access. Much larger South Keeling Island consists of 24 islets, of which two are permanently inhabited: Home Island and West Island. The airport is on West Island, which is largely populated by Australian ex-pats. Home Island is favoured by the large Malay population, brought initially to the islands in the early 1800s by the island’s private owner at the time. Accommodation is available on both islands, but is extremely limited – a maximum of around 68 persons spread between 18 establishments in mid-2025.
July is the second wettest month of the year on the islands with an average of 19.7 days with rain (Table 1). It’s mostly small-scale convective precipitation, so there are usually breaks in the cloud cover. There are no sunshine measurements on the island and so we must fall back on the satellite photos over the past 23 years for enlightenment.
Observations from the Terra polar-orbiting satellite on those July 22s reveals that skies were clear on 12 of the 23 years, and the eclipse would be visible on another 2 with a small amount of movement (the only kind possible on the islands) to get into open skies. That’s not a great average, but it’s better than the precipitation record would seem to suggest. The average long-term cloudiness from orbit over the 23 years is a little higher, at 63 percent, likely because of the coarse resolution of the satellite observations, which does not see the fine details visible to the eye.
Christmas Island
Nearly 1,000 km farther along the track, the lunar shadow comes to Christmas Island where accommodations are similarly limited. However, the average cloud cover measured from Terra is more promising, averaging around 40 percent over the 23 years. That average seems too generous, as the island is seldom without a mantle of broken cumulus clouds. Observations from the airport show only 1 clear day in the month every 2-3 years; 13 days are reported as “cloudy,” which leaves the remaining 17 as “partly cloudy,” which seems pretty typical for a tropical island. Openings in the cloud cover are almost always present and the sky is seldom overcast – only 3 times in the 23 past July 22s. The challenge on the island will be to find one of the transitory openings between the endemic cumulus clouds in time to see the eclipse. Roads are narrow and limited, and often immersed within a forested landscape. Open skies away from the small communities are limited, though the airport area and the golf course will give a good view of the sun. With the approaching shadow, temperatures will fall and the smaller convective clouds will begin to dissipate. It will be a difficult location for an eclipse view, but not hopeless and you can share it with uncountable millions of land crabs.
New Zealand
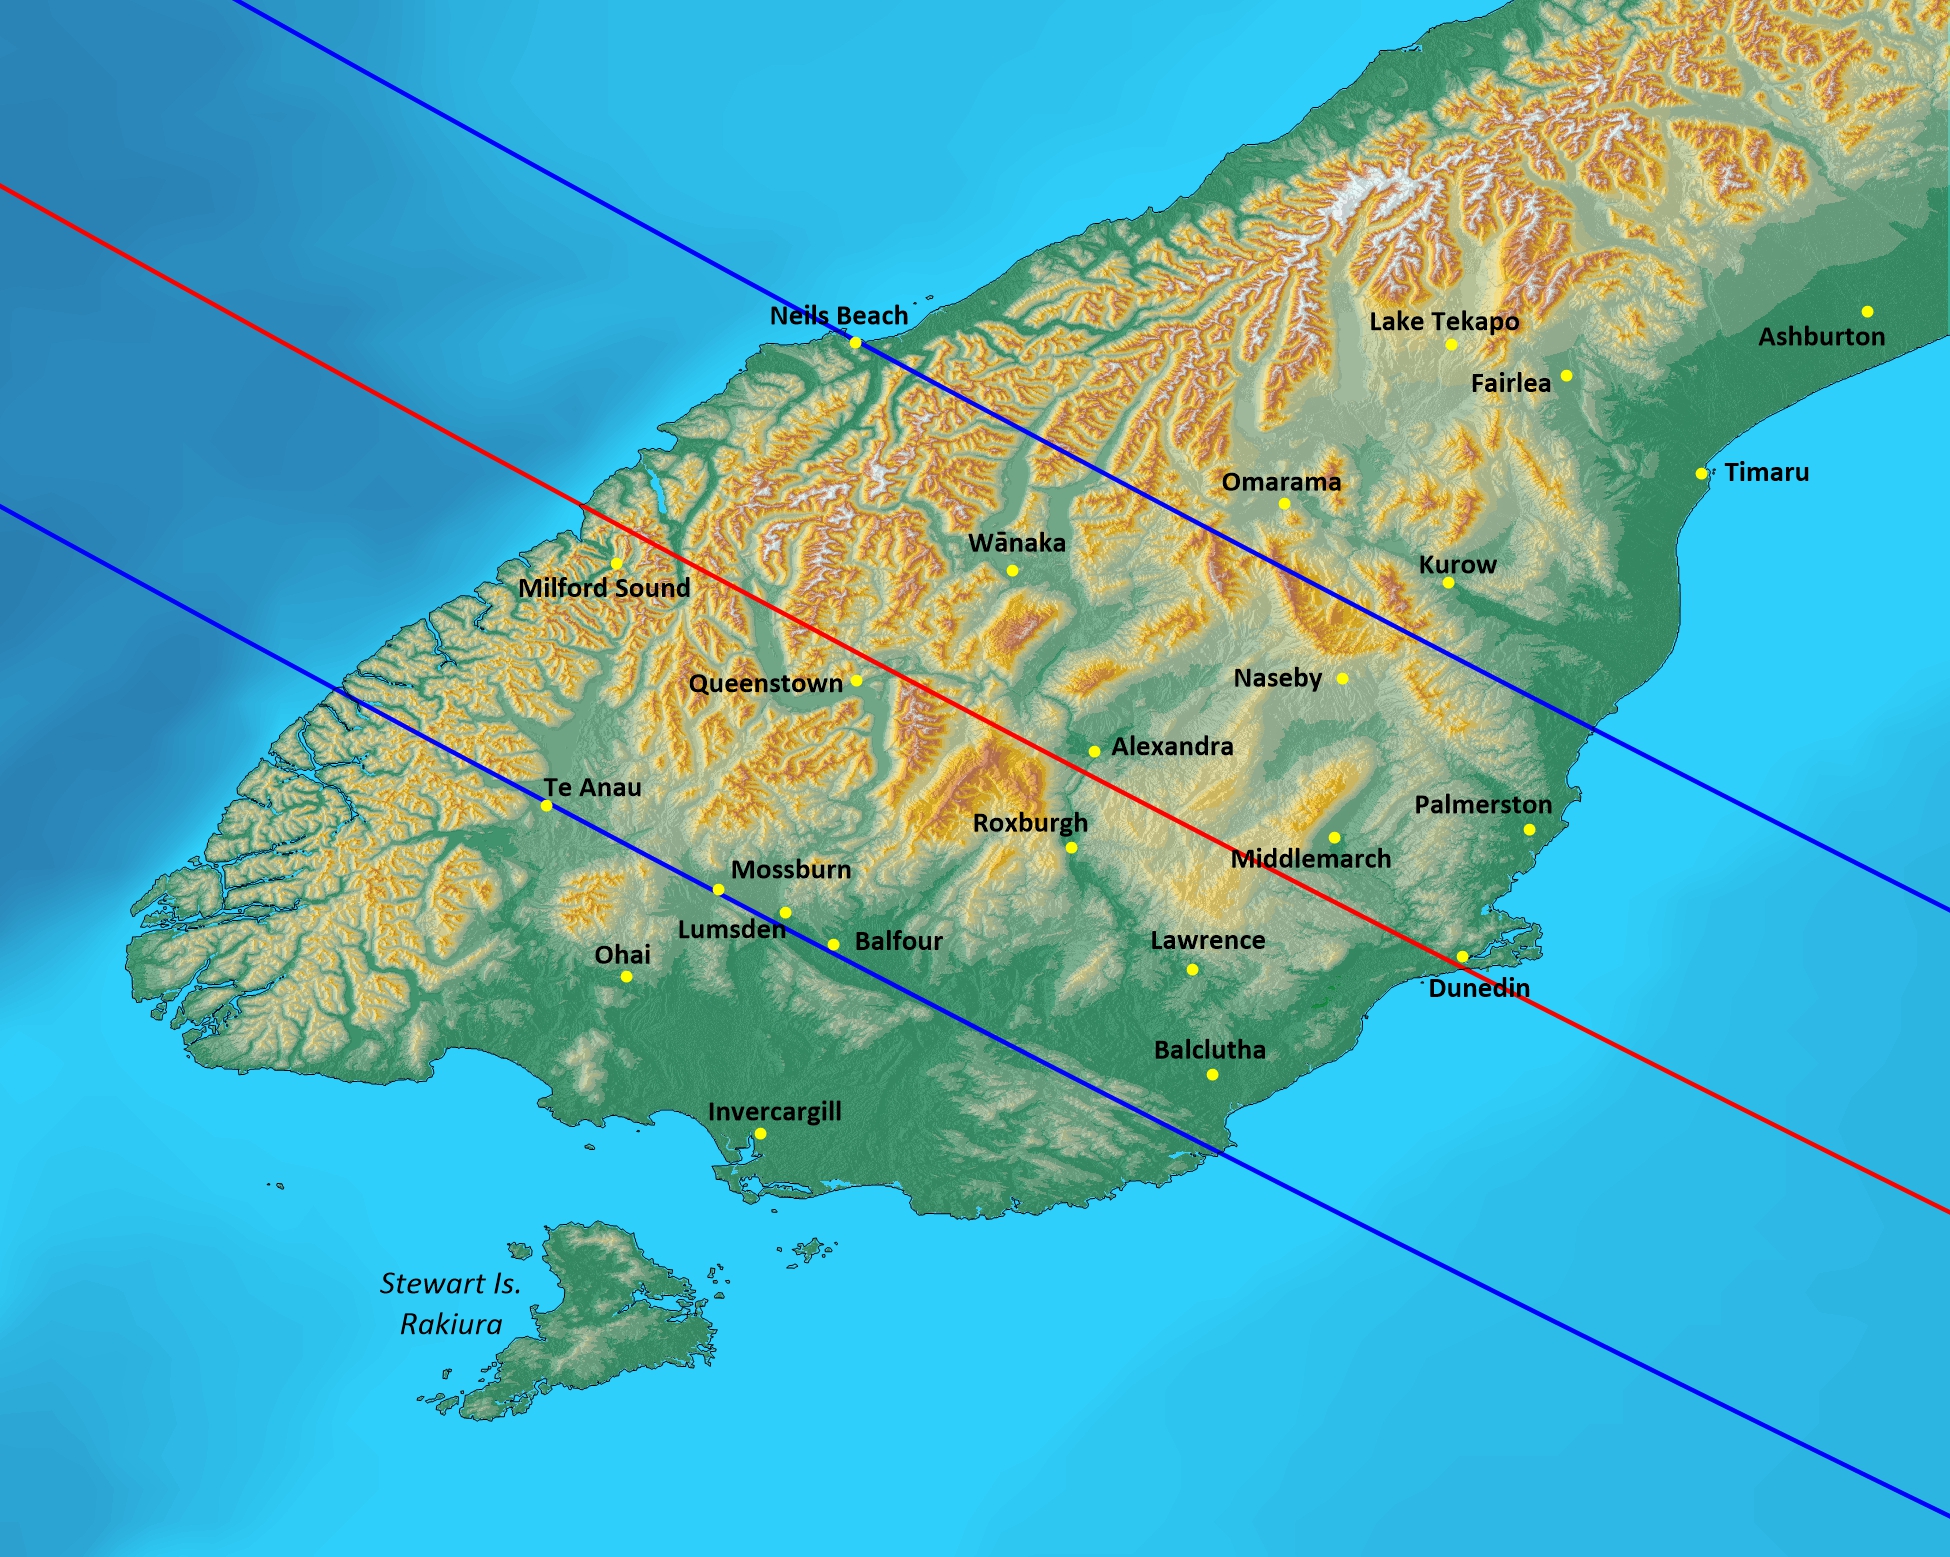
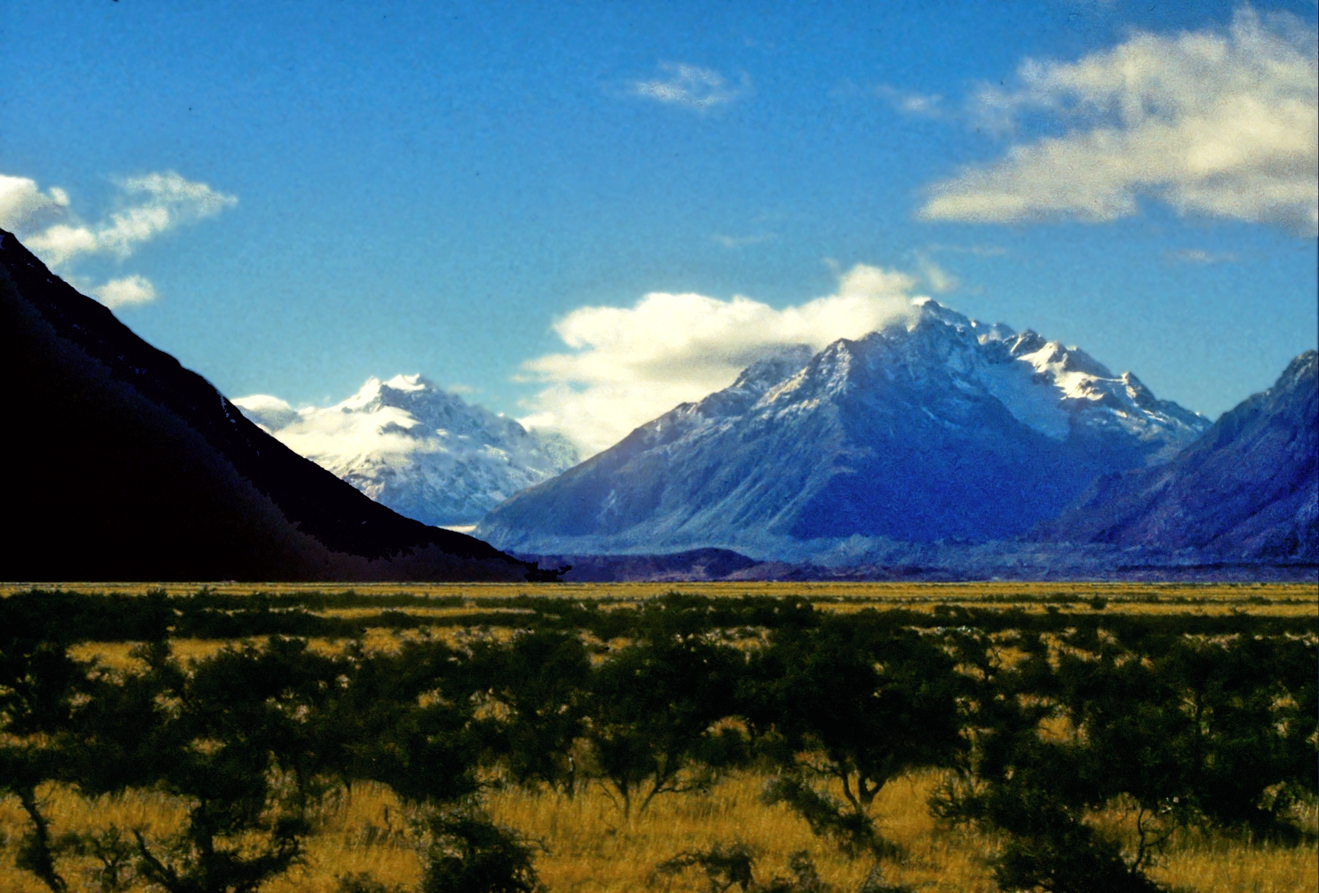
The states of Southland, Otago, and West Coast on the South Island of New Zealand catch the eclipse when it is low in the sky (~9° altitude at maximum), a factor that places a premium on clear skies toward the horizon. Terrain is dominated by the Southern Alps, a mountain range that stretches the length of the South Island and reaches a height of 3,700 m at Mount Cook. Away from the Alps, the landscape flattens toward the southeast coast, but with several mountain segments interspersed with small and deep valleys. It’s a complex topography in which the sight lines toward the Sun at totality must be carefully evaluated before eclipse day.
Because of its high southern latitude, the winter season, and its proximity to the Southern Ocean, the South Island is subject to all of the forms of weather that Mother Nature can invoke. In addition to the mobile low-pressure systems with their large cloud shields, cloud patterns are complicated by wave clouds downwind of the mountains, convective buildups, extensive fog patches that persist into the afternoon, marine stratus that creeps onshore from the cold ocean, and up- and down-slope flows over higher elevations. What is a delight to a meteorologist, however, is not welcomed by an eclipse watcher.
Figure 6, derived from daily overpasses of the several polar-orbiting satellites, shows that average cloudiness varies between 45 and 80 percent along the shadow track. The cloudiest location lies at the south limit in the vicinity of Te Anau while sunshine is most prevalent on the opposite side of the track near Wānaka. For the most part, cloud is more prevalent on the north side of the Alps and least where mountains block the flow, from Wānaka to Palmerston . On the south limit, between Balclutha and Balfour, a flat landscape allows the flow from the Southern Ocean to spread inland, giving a tongue of higher cloudiness that sneaks up the valleys toward Queenston.

Fog is a common visitor between March and August, particularly at Alexandra (24 days) and Dunedin (41 days) in Otago and at Te Anau in Southlands. Snow is a regular feature of the mountain peaks, but less so at lower elevations. At Alexandra, it comes on an average of four days in the winter; at Dunedin, 8 days, but at Queenston, deeper in the mountains, on 12 days. In Fiordland, the section of the Alps stretching from Milford Sound to Te Anau and southward, single snowfalls can dump 2-3 metres of snow on the mountains
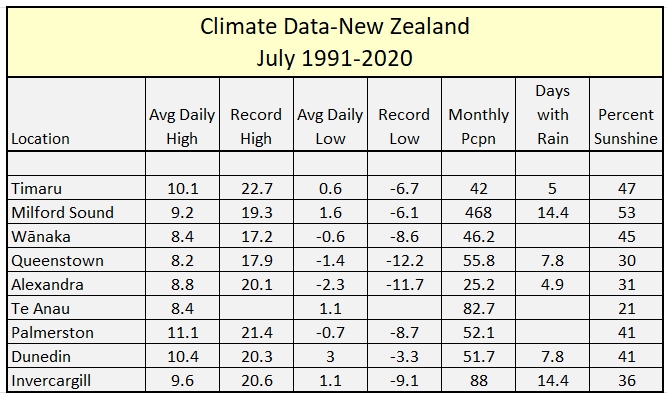
Surface-based sunshine measurements in Table 2 are as variable as the satellite-based cloud statistics. Values range between 30 and 53 percent. Milford Sound has the largest fraction of sunny hours, at 53 percent – decent enough for a winter season, but well below values measured over Australia. Sunshine hours at Wānaka, Palmerson, and Dunedin are compatible with the orbital values, but Milford Sound’s sunshine percentage is out of line with the satellite cloud climatologh, though encourages a trip to this delightful place.
Because of the patchy and highly variable nature of New Zealand’s cloud cover, the ability to move will be of limited benefit. However, as long as a big frontal system or mid-latitude low hasn’t covered the island with cloud, there is likely to be some nearby openings in the cloud that a mobile observer can adopt. Given the magnificent mountain vistas and the low altitude of the sun, a sunny day can provide spectacular images of the eclipse, particularly in the island’s pristine skies.
Managing the weather
A successful eclipse is prefaced by three meteorological tasks. The first and easiest is to pick a spot where cloud cover is least likely. The second is to make use of numerical weather forecasts for advanced planning in the days before. The third is to be familiar with satellite imagery, both visual and infrared, for last-minute changes. It’s a bit like storm-chasing, but without the need to first make sure that a storm will actually occur.
Eclipsophile will help satisfy the first factor. For the second and third, there are many web sites that will provide you with access to the models and to satellite images. I prefer Windy.com; you may have your own favourite, but ask around. The models that the various sites provide are all pretty much the same, so go with a display that you like.
Numerical models come in several flavours and not all are global in nature. The European ECMWF is generally regarded as the best of the global models, but there are others such as the U.S. GFS or the German-Swiss ICON models. For this eclipse, the model (ACCESS-C) from the Australian Bureau of Meteorology (BoM) may be the most reliable, but you can only tell after using it for some time. It’s available on Windy, but only the BoM’s lower-resolution ACCESS model extends as far as New Zealand. New Zealand has high-resolution models of its own, but its forecast service operates on a quasi-commercial basis and you will have to make some effort to obtain it. because of the complex topography across the eclipse track, the highest resolution models (e.g. the ECMWF) are likely to perform best.
Models will differ from each other, but will converge on the same solution as the time of the eclipse approaches – after all, they are trying to forecast the actual weather, of which there is only one solution. You cannot tell which of the solutions will be correct, but by looking at several, you can see where the models agree or disagree and take that uncertainty into your planning. They are more reliable both when they agree with each other and when they continue the same forecasts from day to day as the moment approaches. Don’t be too ready to react if the forecast is more than a week in the future; five days is a better time to start advance planning.
Satellite images come in several forms – a dozen or so if you want to explore. They are only good for the short term and short range: moving a ship or driving a hundred kilometres down the road. At night, infrared images are all that’s available and they sometimes don’t show low cloud very well. Learn to use and interpret them ahead of time, though for this eclipse, which takes place well into the daytime, the visible images are probably enough. Windy is a bit slow to update, but allows you to zoom into the full resolution of the satellite sensors.
And, when it’s over, you can use the satellite animations to watch the shadow of the Moon move across the globe.
November 2025